TT38® Talent Test
The TT38® Talent test is developed based on modern strength-based research in positive psychology. The test consists of 440 questions and takes approximately 30 minutes to complete. The questions appear in pairs in an ipsative format. This means that you not only have to decide how much you agree or disagree with a statement, but also which of two statements you relate to the most. Thus, the test builds a picture of the relative strengths of your talents. Each element that the TT38 tests, you end up answering at least 12 times in different ways. In this way, the test gives you a stable overview of your talents, so you can rely on the validity of the results.
Once you have taken the TT38® Talent Test, a report is generated based on your results. The report is approximately 20 pages long and contains not only a complete overview of your talents, but also assessments of how these talents influence your daily behavior. It also contains nine graphs, each of which tells you something about how you best present yourself in a professional context. The report will help you and your team gain an understanding of your own and each other’s talents and how you can use them to develop and improve productivity, well-being and acceptance of each other’s strengths and weaknesses.
Below are some of the elements of the report, with a focus on how you can use them to play to your strengths and make the most of the human resources that are critical to your success.
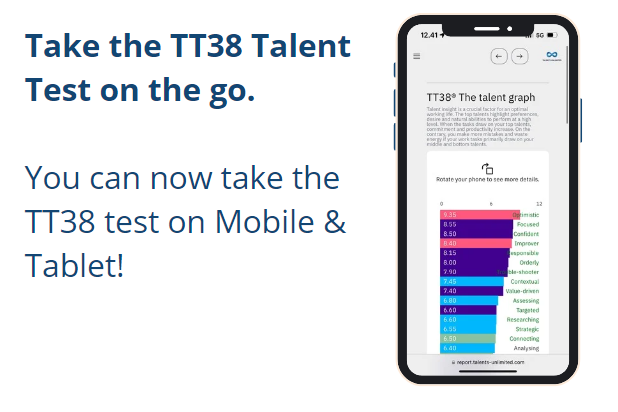
The 34 talents
This graph represents the engine of the test and is one of the most important elements of the report generated for you after you have completed the TT38 Talent Test. It is an overview of the 34 talents ranked according to their strength in relation to each other. Talents reflect cognitive abilities, patterns and ways in which people respond. If you work with your top talents, you are efficient and can deliver more and better output than if you work with your middle talents. It’s also energizing and fun as you perform and make few mistakes. This increases engagement and well-being, two factors that science really points to when looking for markers of high productivity. Conversely, when you work with your bottom talents, you’re likely to be quickly drained of energy, and you run the risk of your work being flawed.

Conflict style
This graph shows what your talent mix means for your discussion strengths, which is a term for the style you are most likely to adopt in a discussion. Each discussion strength represents a distribution of your focus on the goal and your focus on the relationship. For example, if your strength is to be compromising in a discussion, it indicates that you divide your focus equally between achieving the goal and maintaining the relationship with your discussion partners. The graph sheds light on which discussion position you will automatically take if you don’t reflect on it. Understanding your own discussion patterns is an indispensable advantage if you want to learn about the nature of interaction in your team.

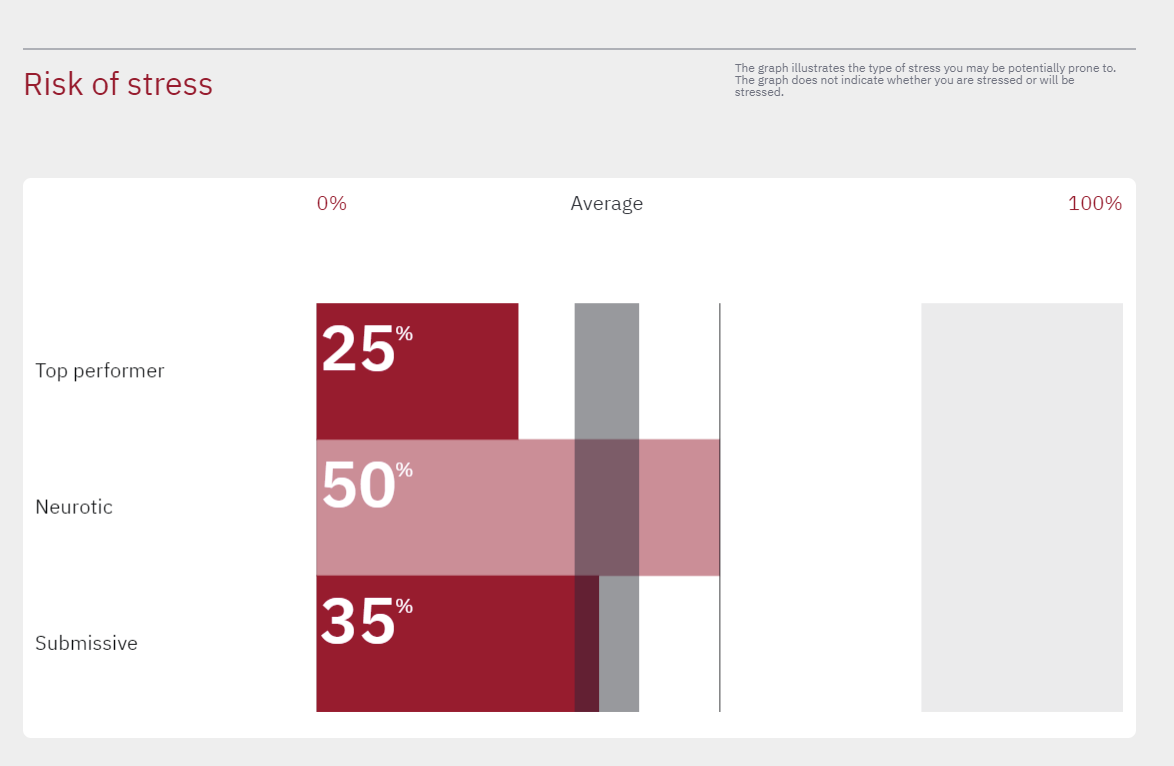
Risk of stress
The stress risk graph gives you insight into whether you are at risk of developing one or more of three specific stress types. The vertical line indicates the average risk of developing stress for the Danish population, and if you exceed this, you should pay extra attention to possible stressors in your everyday life. The graph makes it possible for you and your manager to plan individual preventive measures to minimize the risk of stress and burnout at work. This is largely made possible by understanding what stress profile you are likely to exhibit if things are about to go wrong.
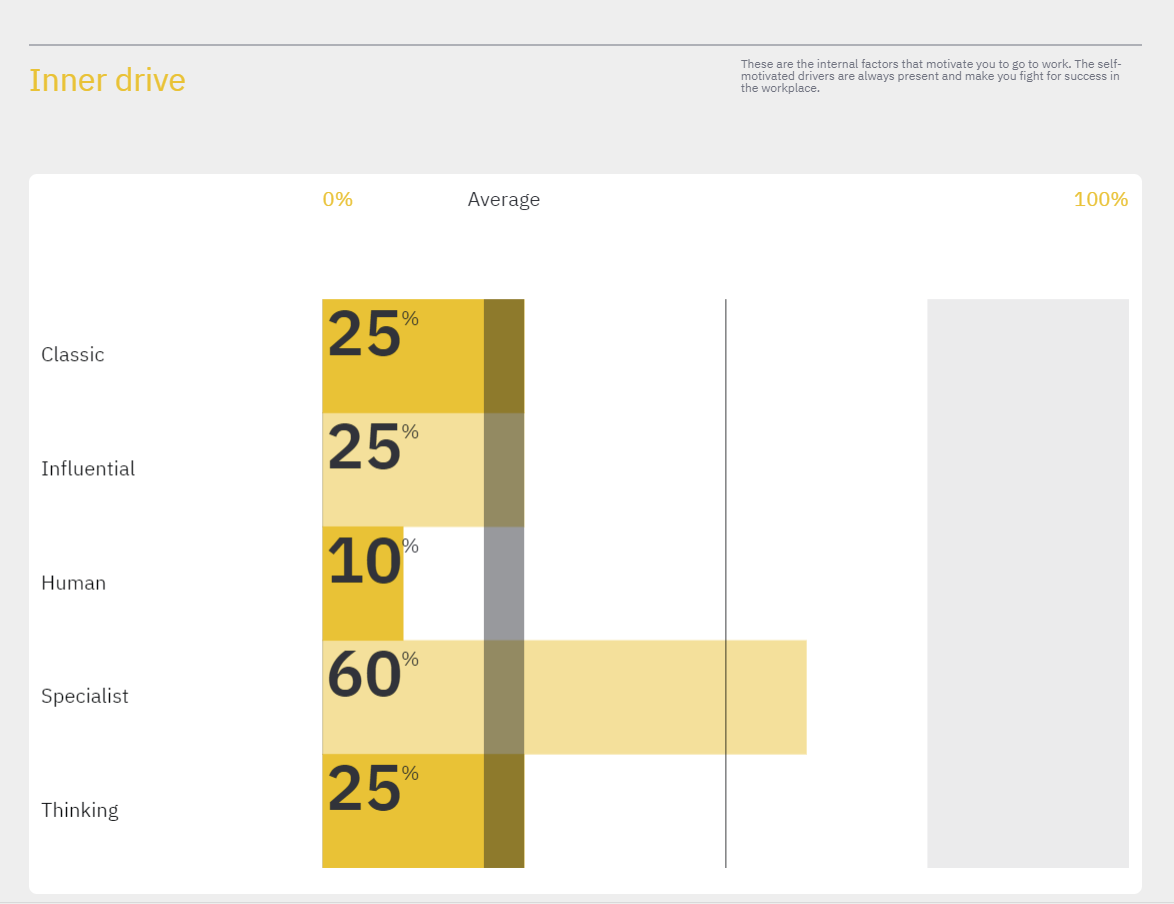
Inner drive
Driving forces are an expression of your inner motivation and spark – what makes you love going to work. The graph is a tool for you and your manager to understand what elements need to be present in your work to keep you engaged. Similarly, it increases your understanding of your colleagues’ or employees’ behavior, as their intrinsic motivation often explains their actions. The drivers reveal that the implicit assumption that other people are driven by the same things we are rarely holds true.
Motivation
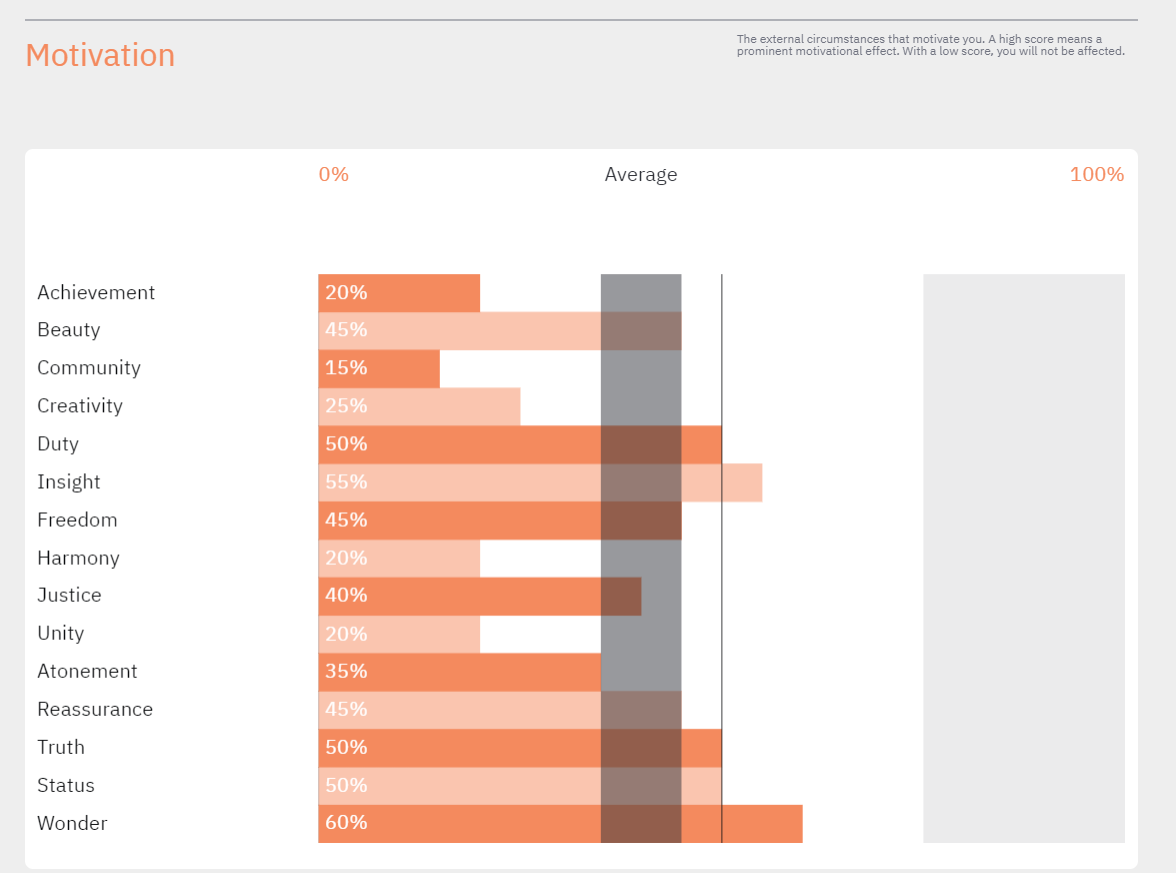
Motivational strengths are closely related to driving forces, yet are a more concrete expression of what energizes you when you work. It can serve as a guide for your manager, who can more easily set you desired tasks if he or she is aware that you seek, for example, freedom and status in your professional life. Conversely, certain elements can have a demotivating effect on you, and it’s crucial that your manager doesn’t try to motivate you in the wrong way, as this can reduce your engagement and lead to poor performance.
Work focus
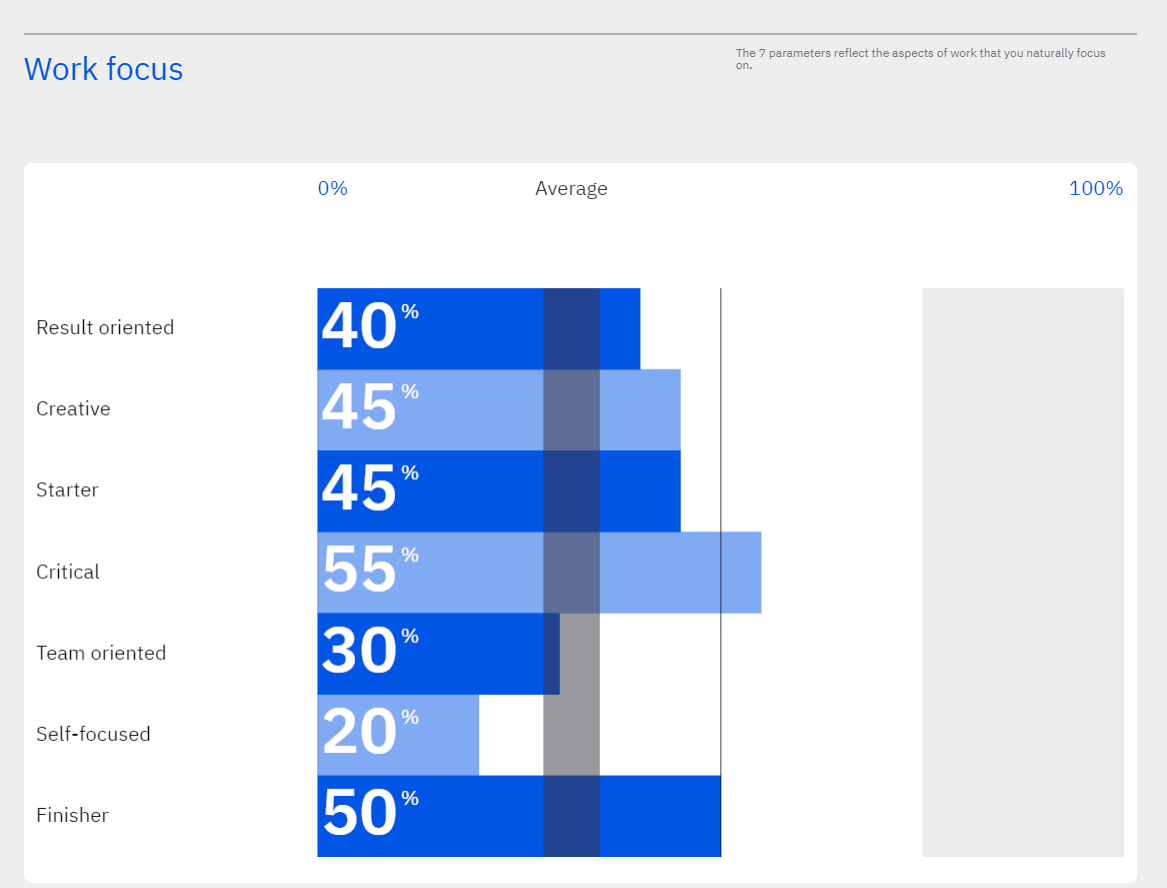
This graph is an illustration of what behaviors you will naturally exhibit in a work situation based on your talents. The possible behaviors in the graph are based on the seven qualities that managers most look for in new hires. The graph can help them understand why your team reacts the way you do when you take on a specific project and the challenges and successes you experience.
Team strengths
Team strengths
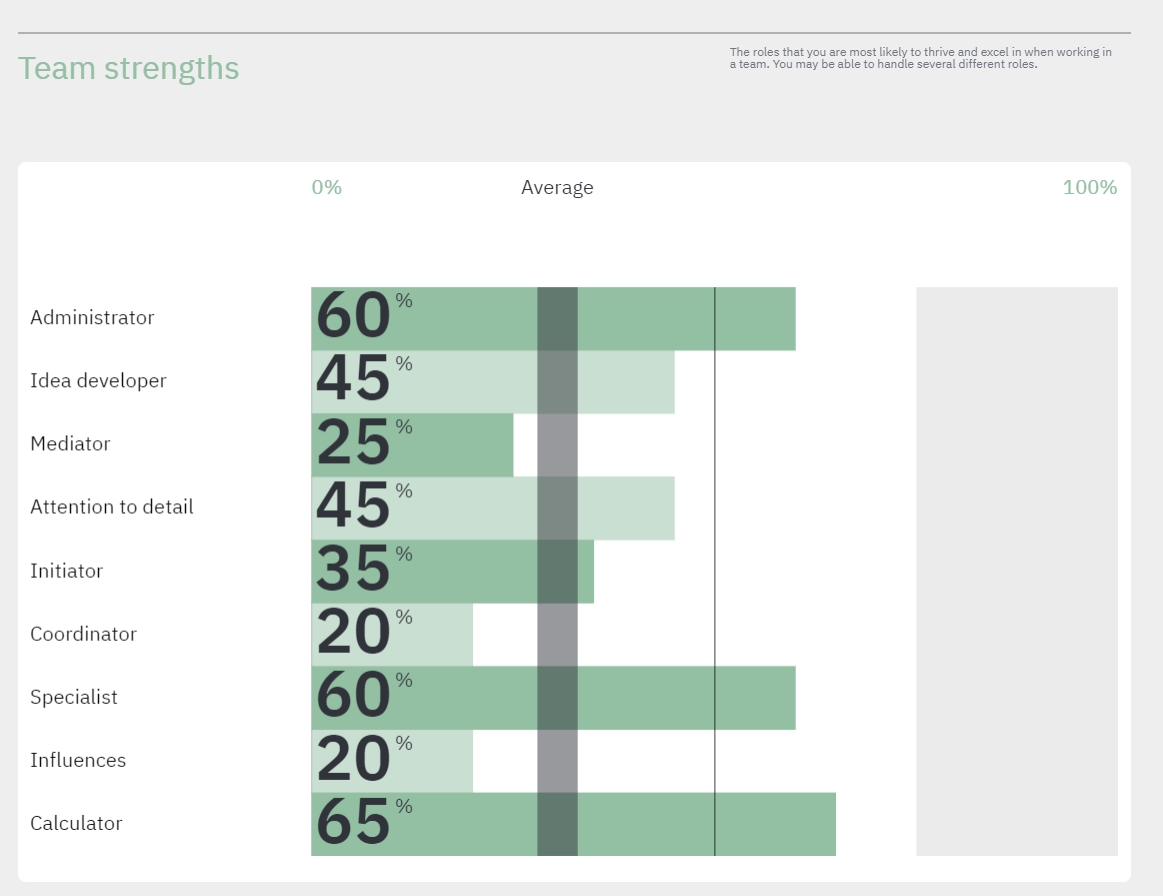
The graph is a visualization of your ability to step into each of the nine team roles that research suggests must be filled for a team to perform at its best. You will experience greater productivity and engagement when you work in the roles in which you score the highest, and similarly, it is difficult to be successful if you work in roles where you have a low score. The graph is thus useful for managers who need to put together a team. It allows them to stage employees in their best roles, and they can also clarify which roles you currently cannot fill and need to bring in new people.
Innovation
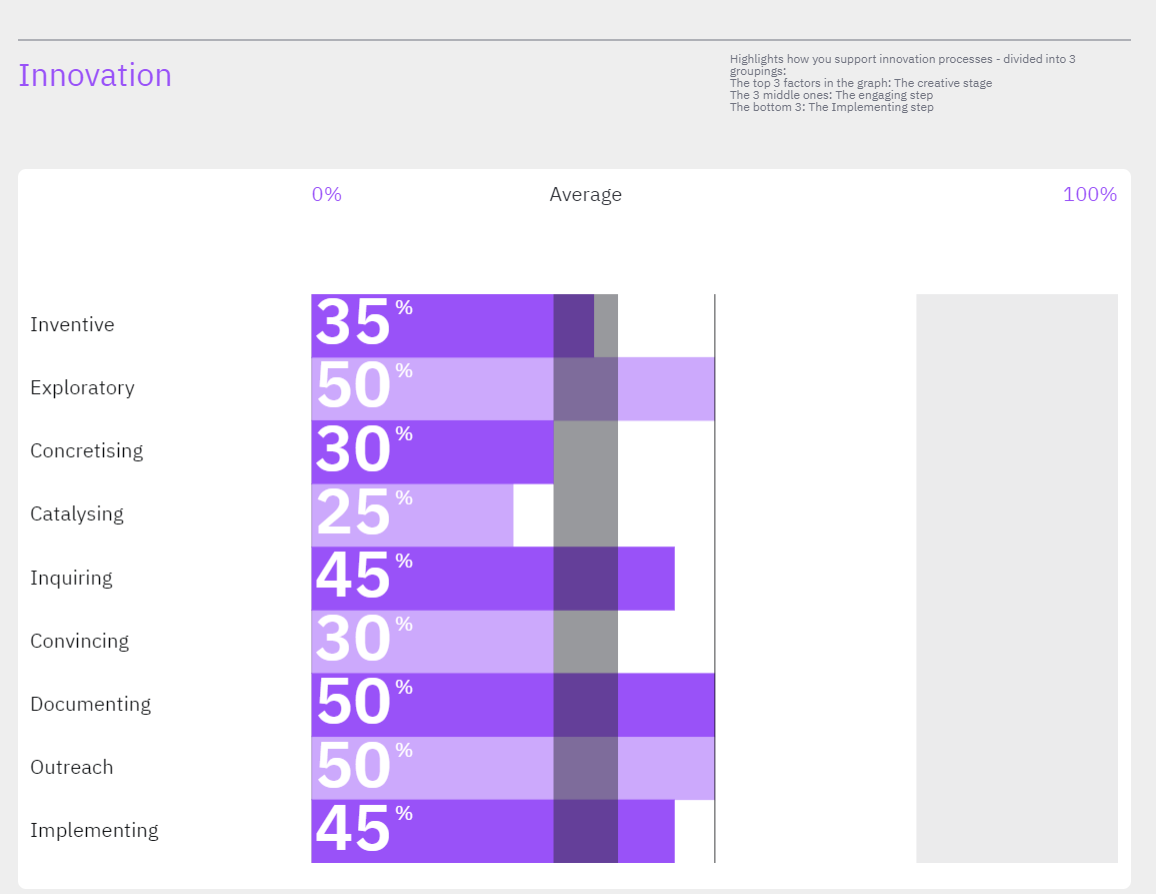
The graph provides an overview of where you can support the innovation process along the way from early idea stage to final implementation. Innovation is ephemeral and, like team roles, success requires an organization to have nine types of input to ensure that innovations realize their potential. The graph is used by leaders in project-based organizations to put together the right innovation teams so that those on board can work in the phases of innovation where they each create the most value.
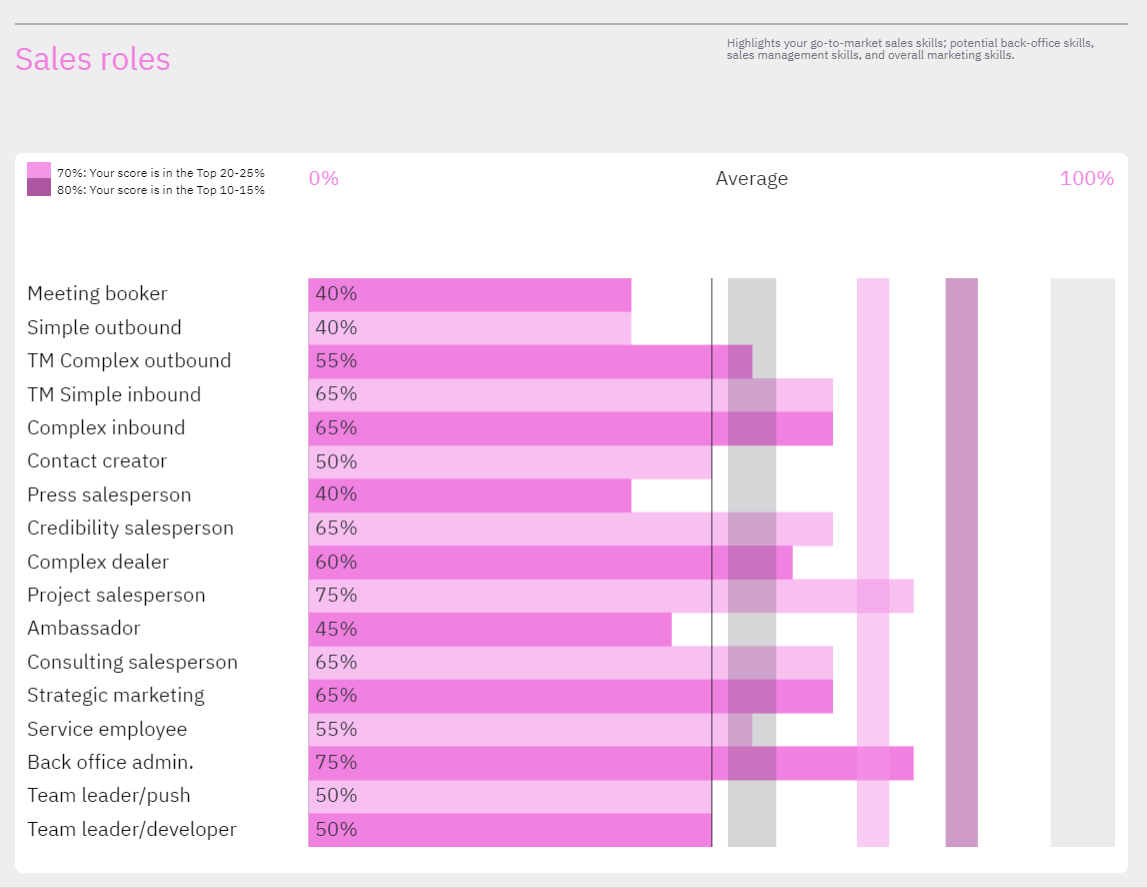
Sales roles
The graph indicates which sales roles you have the most potential in. The higher your score, the faster you can learn to sell in that role. The graph is then used to focus your sales efforts so you can concentrate on the product categories or segments that best fit your optimal roles. A good salesperson in a particular sales role scores over 70%, and it’s not uncommon to score high on a handful of roles simultaneously.
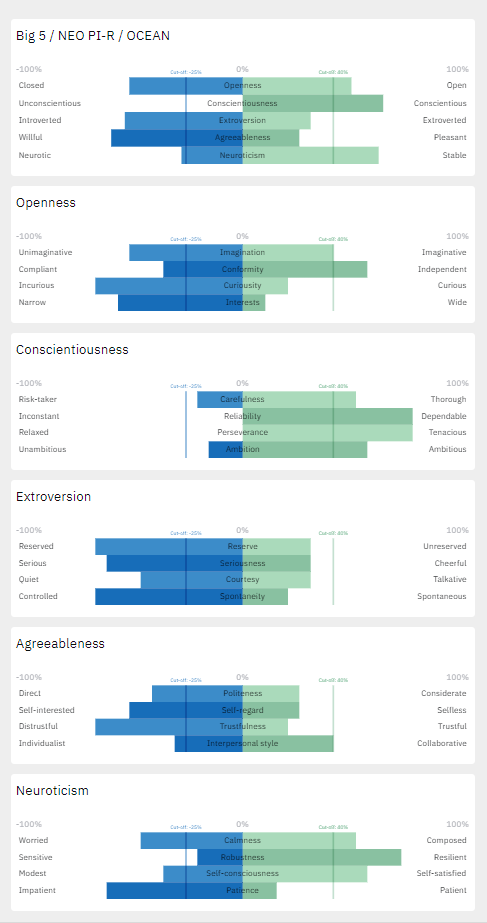
BIG 5 / NEO PI-R / OCEAN
Your talents provide an indicator of your personality based on the recognized five-factor model. First, the five overarching psychological dimensions that research divides personality into are shown and then subdivided into specific categories. The opposing scales within each personality factor indicate where your talents and development potential lie based on your talents.
