
TT38 Talent Test
The Talent Test consists of two types of graphs: One that shows an individual’s unique talent composition, and second being a series of graphs that describe what that talent composition means in different contexts, such as how to approach discussions or one’s natural roles in teams.
The test is a development tool and not a diagnosis. The whole basis of a Talent Test is to identify how to maximise the unique talents and potential in each and every employee. Each graph thus includes (in the full version of the test) a heatmap that can be used to identify which talents you can work more or less with in order to find development potentials.

TT38® Talent Test
The TT38® Talent test is developed based on modern strength-based research in positive psychology. The test consists of 440 questions and takes approximately 30 minutes to complete. The questions appear in pairs in an ipsative format. This means that you not only have to decide how much you agree or disagree with a statement, but also which of two statements you relate to the most. Thus, the test builds a picture of the relative strengths of your talents. Each element that the TT38 tests, you end up answering at least 12 times in different ways. In this way, the test gives you a stable overview of your talents, so you can rely on the validity of the results.
Once you have taken the TT38® Talent Test, a report is generated based on your results. The report is approximately 20 pages long and contains not only a complete overview of your talents, but also assessments of how these talents influence your daily behavior. It also contains nine graphs, each of which tells you something about how you best present yourself in a professional context. The report will help you and your team gain an understanding of your own and each other’s talents and how you can use them to develop and improve productivity, well-being and acceptance of each other’s strengths and weaknesses.
Below are some of the elements of the report, with a focus on how you can use them to play to your strengths and make the most of the human resources that are critical to your success.
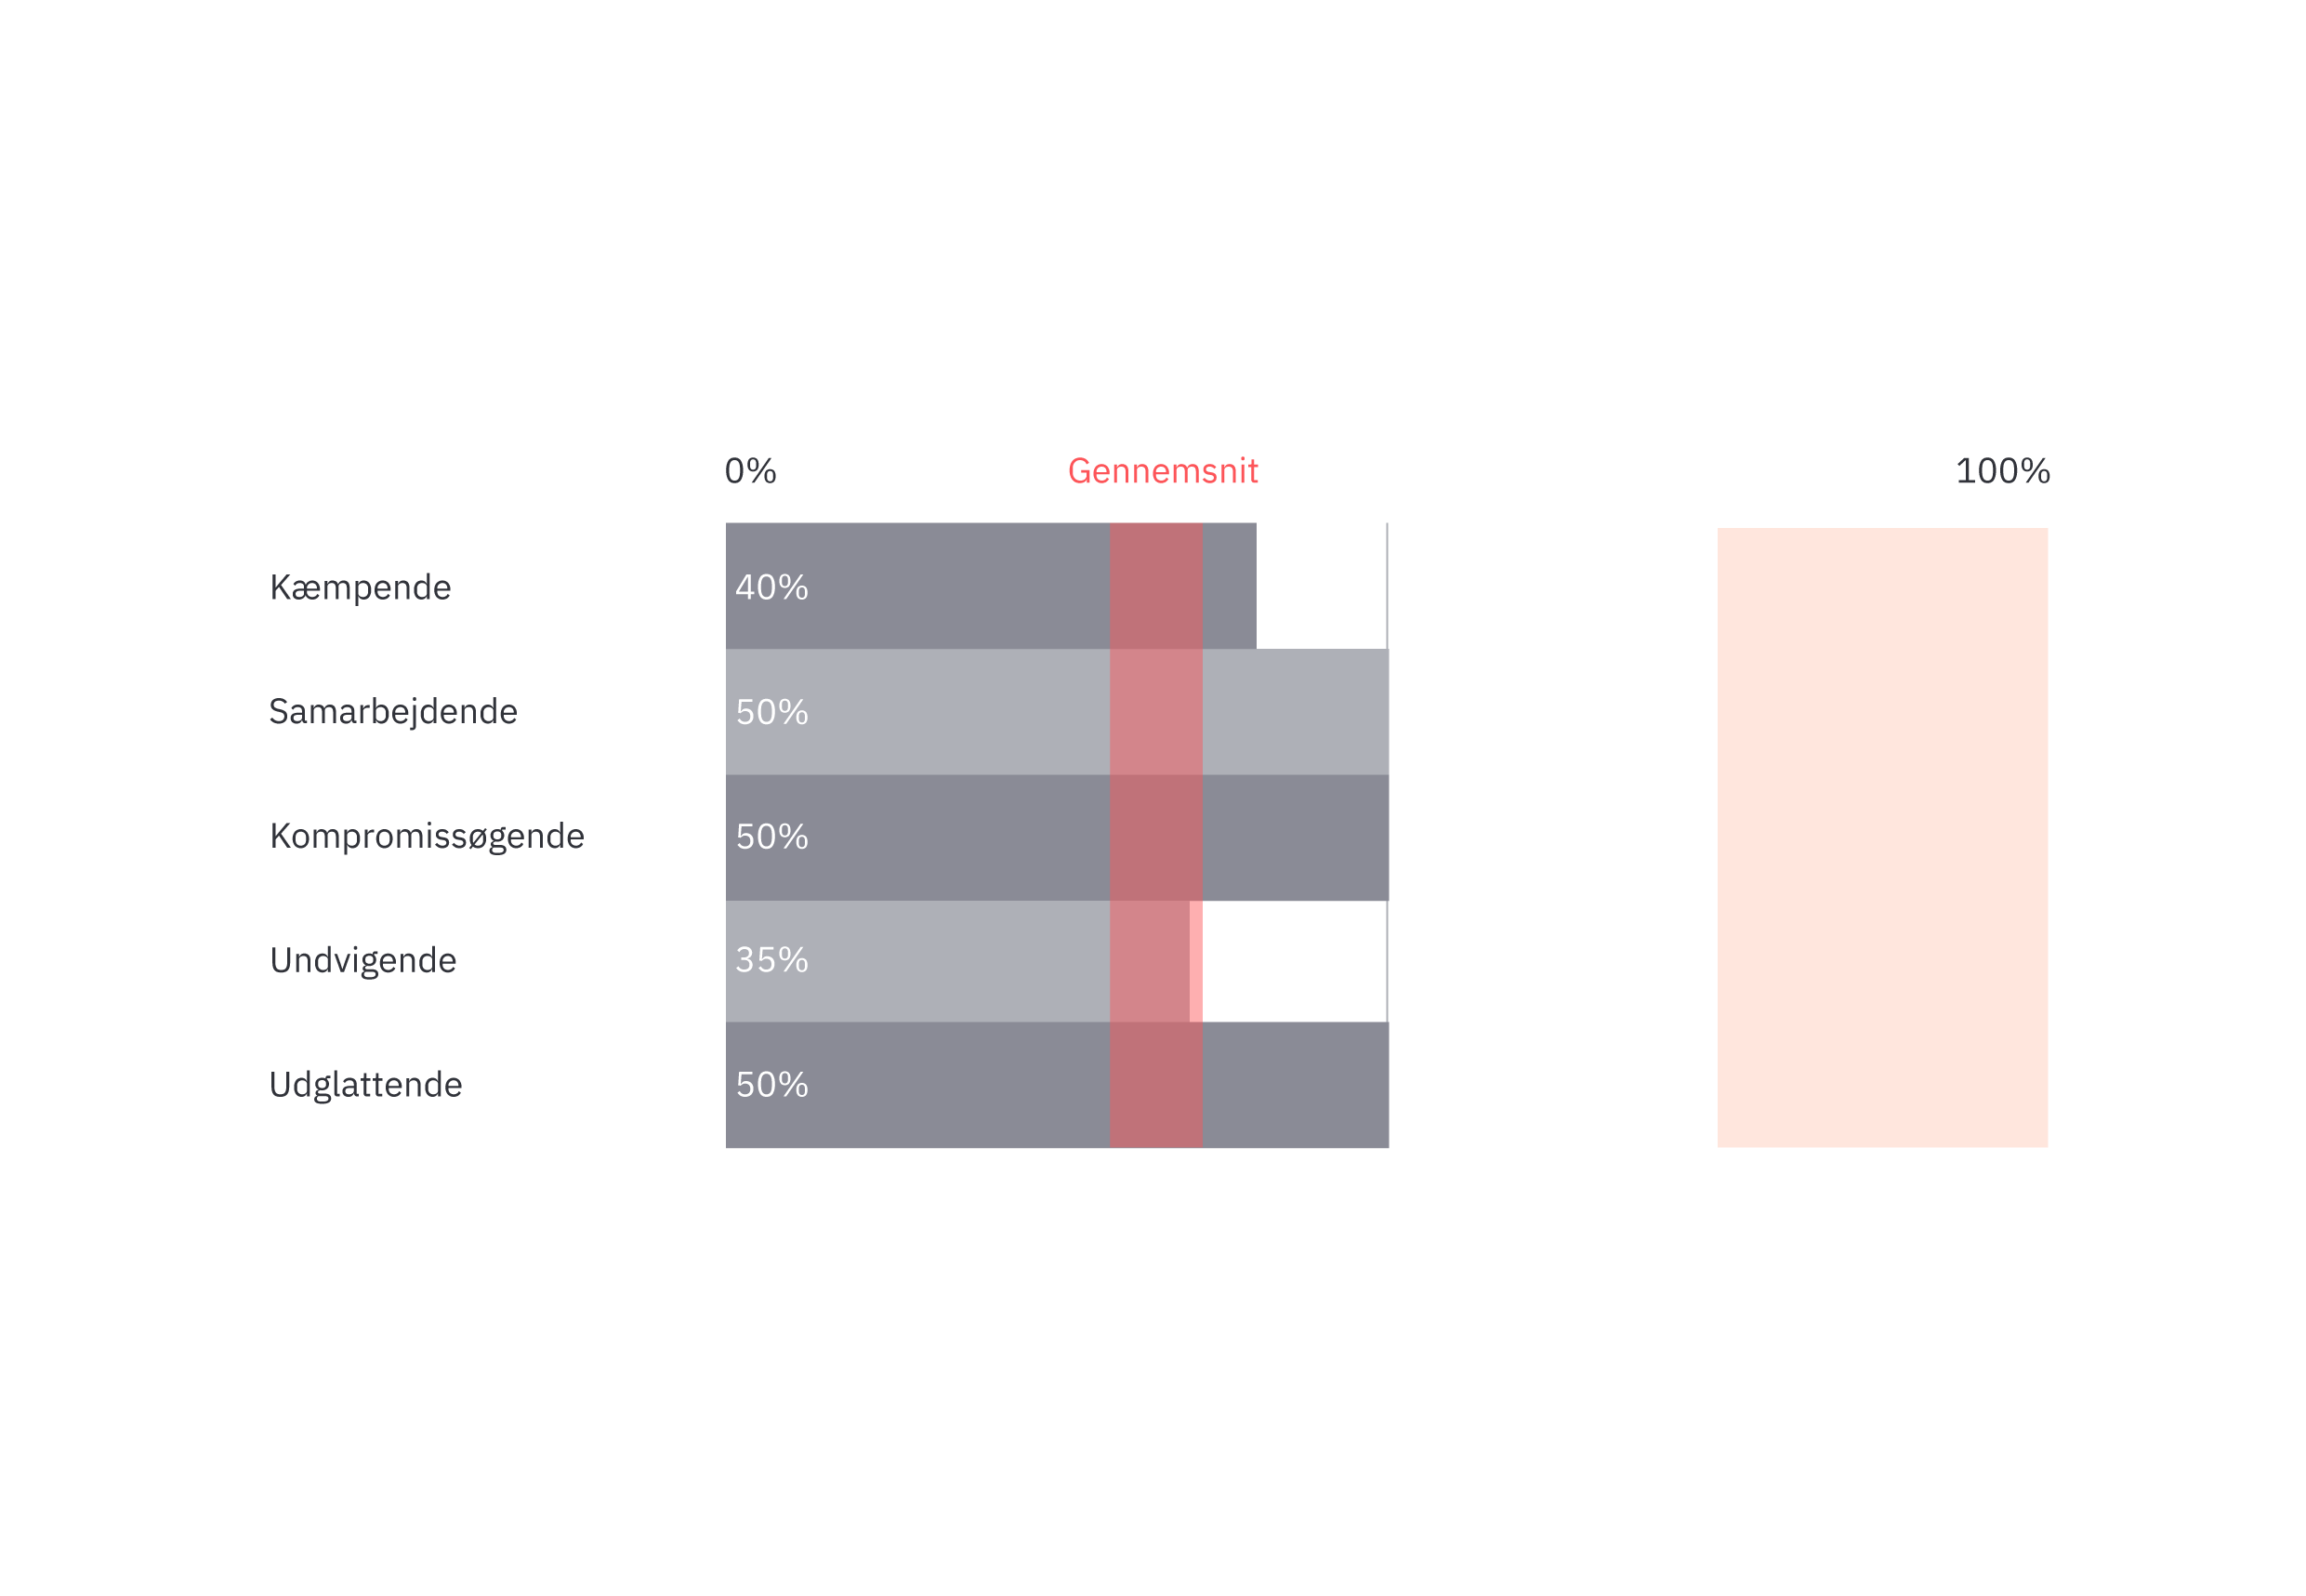
Conflict Style
This graph shows what your talent mix means for conflict style, i.e. how you are most likely to engage in discussions. Here you can be competing, co-operative, compromising, avoiding and accommodating. All conflict styles represent a distribution of percentage focus on goal and focus on relationship. For example, collaborative focus is 100% on the goal while 100% focus on the relationship. This graph firstly shows which style you are most likely to adopt when approaching discussions or disagreements, if you do not take time to reflect on it (i.e. what is the most natural way for you to approach a conflict). Additionally, the graph identifies which of your talents you can focus on and utilise, in order to adjust your default behavioural patterns and thus approach conflicts in a different manner.
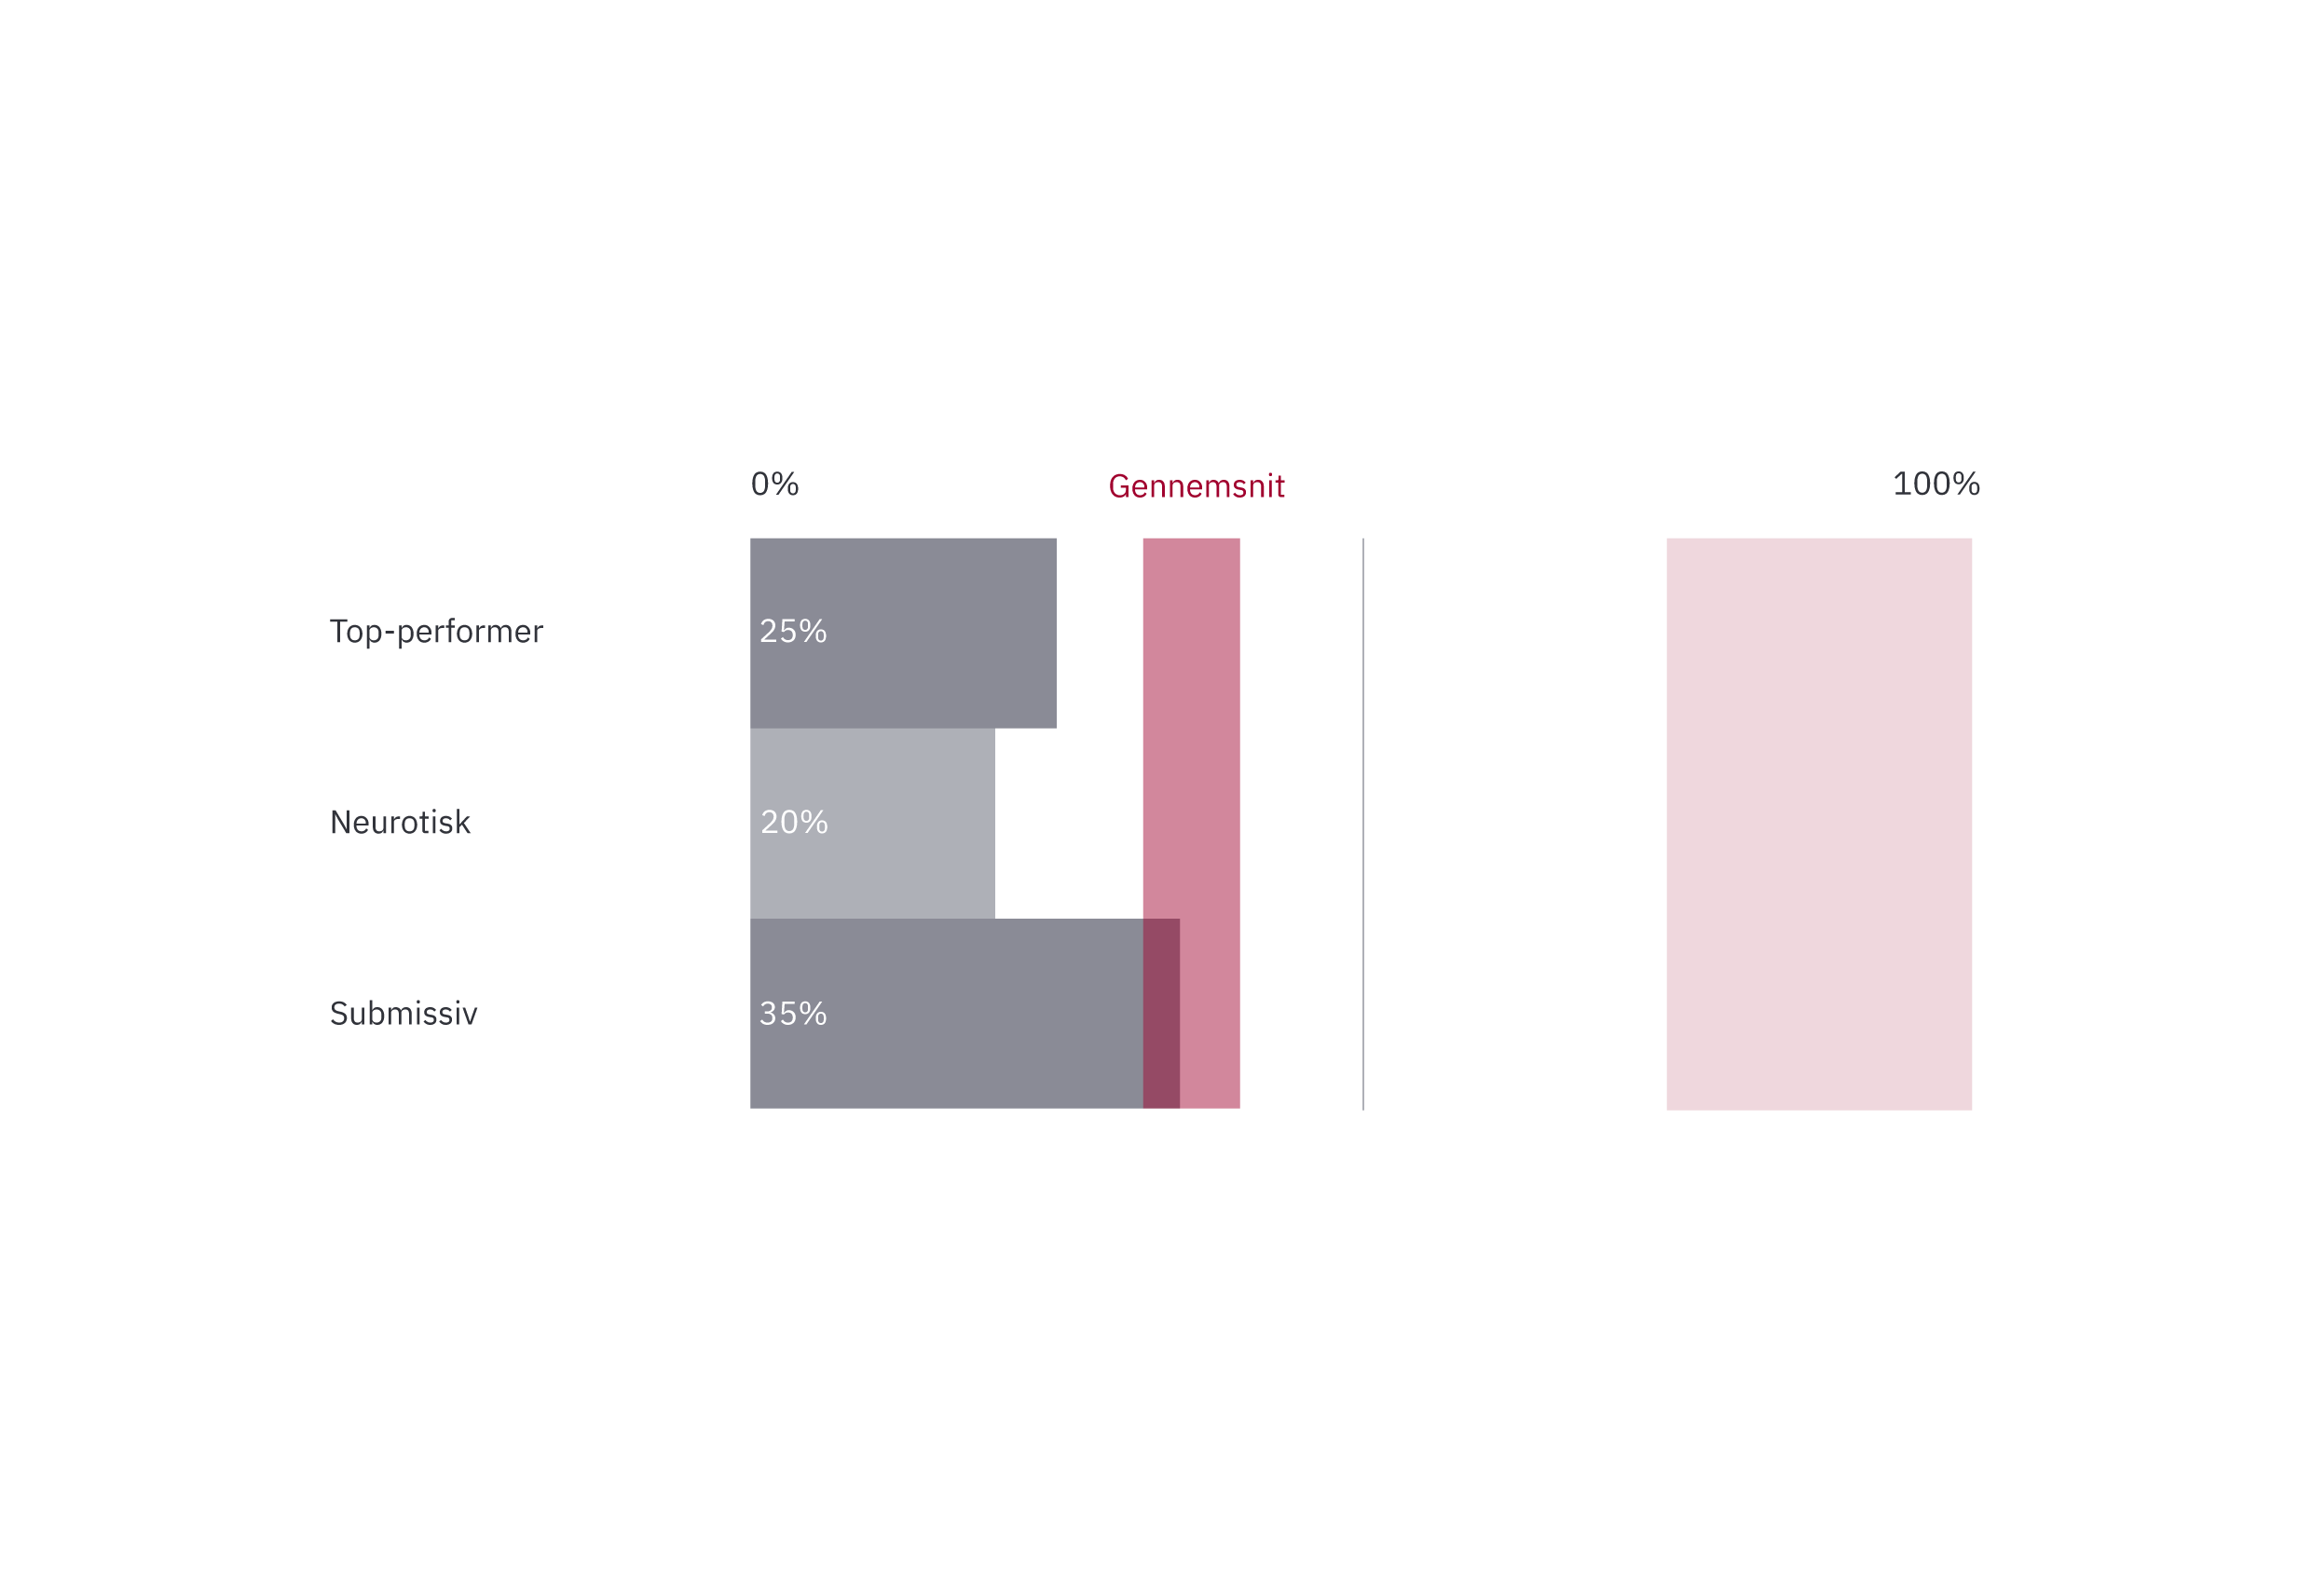
Stress Risk
Stress is a large and frequent problem for many individuals, organisations and society as a whole. The purpose of this graph is to identify which types of stress individuals are most susceptible to, and subsequently enable them to engage in preventive measures to minimise the risk of stress occurring in the workplace. There are three stress tendencies, with the degree of stress risk assessed in accordance to the central average individuating column. It is likely that an individual is at risk for the specific type of stress if their score is in excess of the central average column. The “Top performer” stress risk type indicates the workaholic natured individuals that work hard for long hours. The “Neurotic” stress risk is where individuals possess high levels of worry and anxiety about their work, which is derived from being a perfectionist and a somewhat over-thinker. The “Submissive” stress risk type is triggered by feeling overlooked, suppressed and misunderstood.
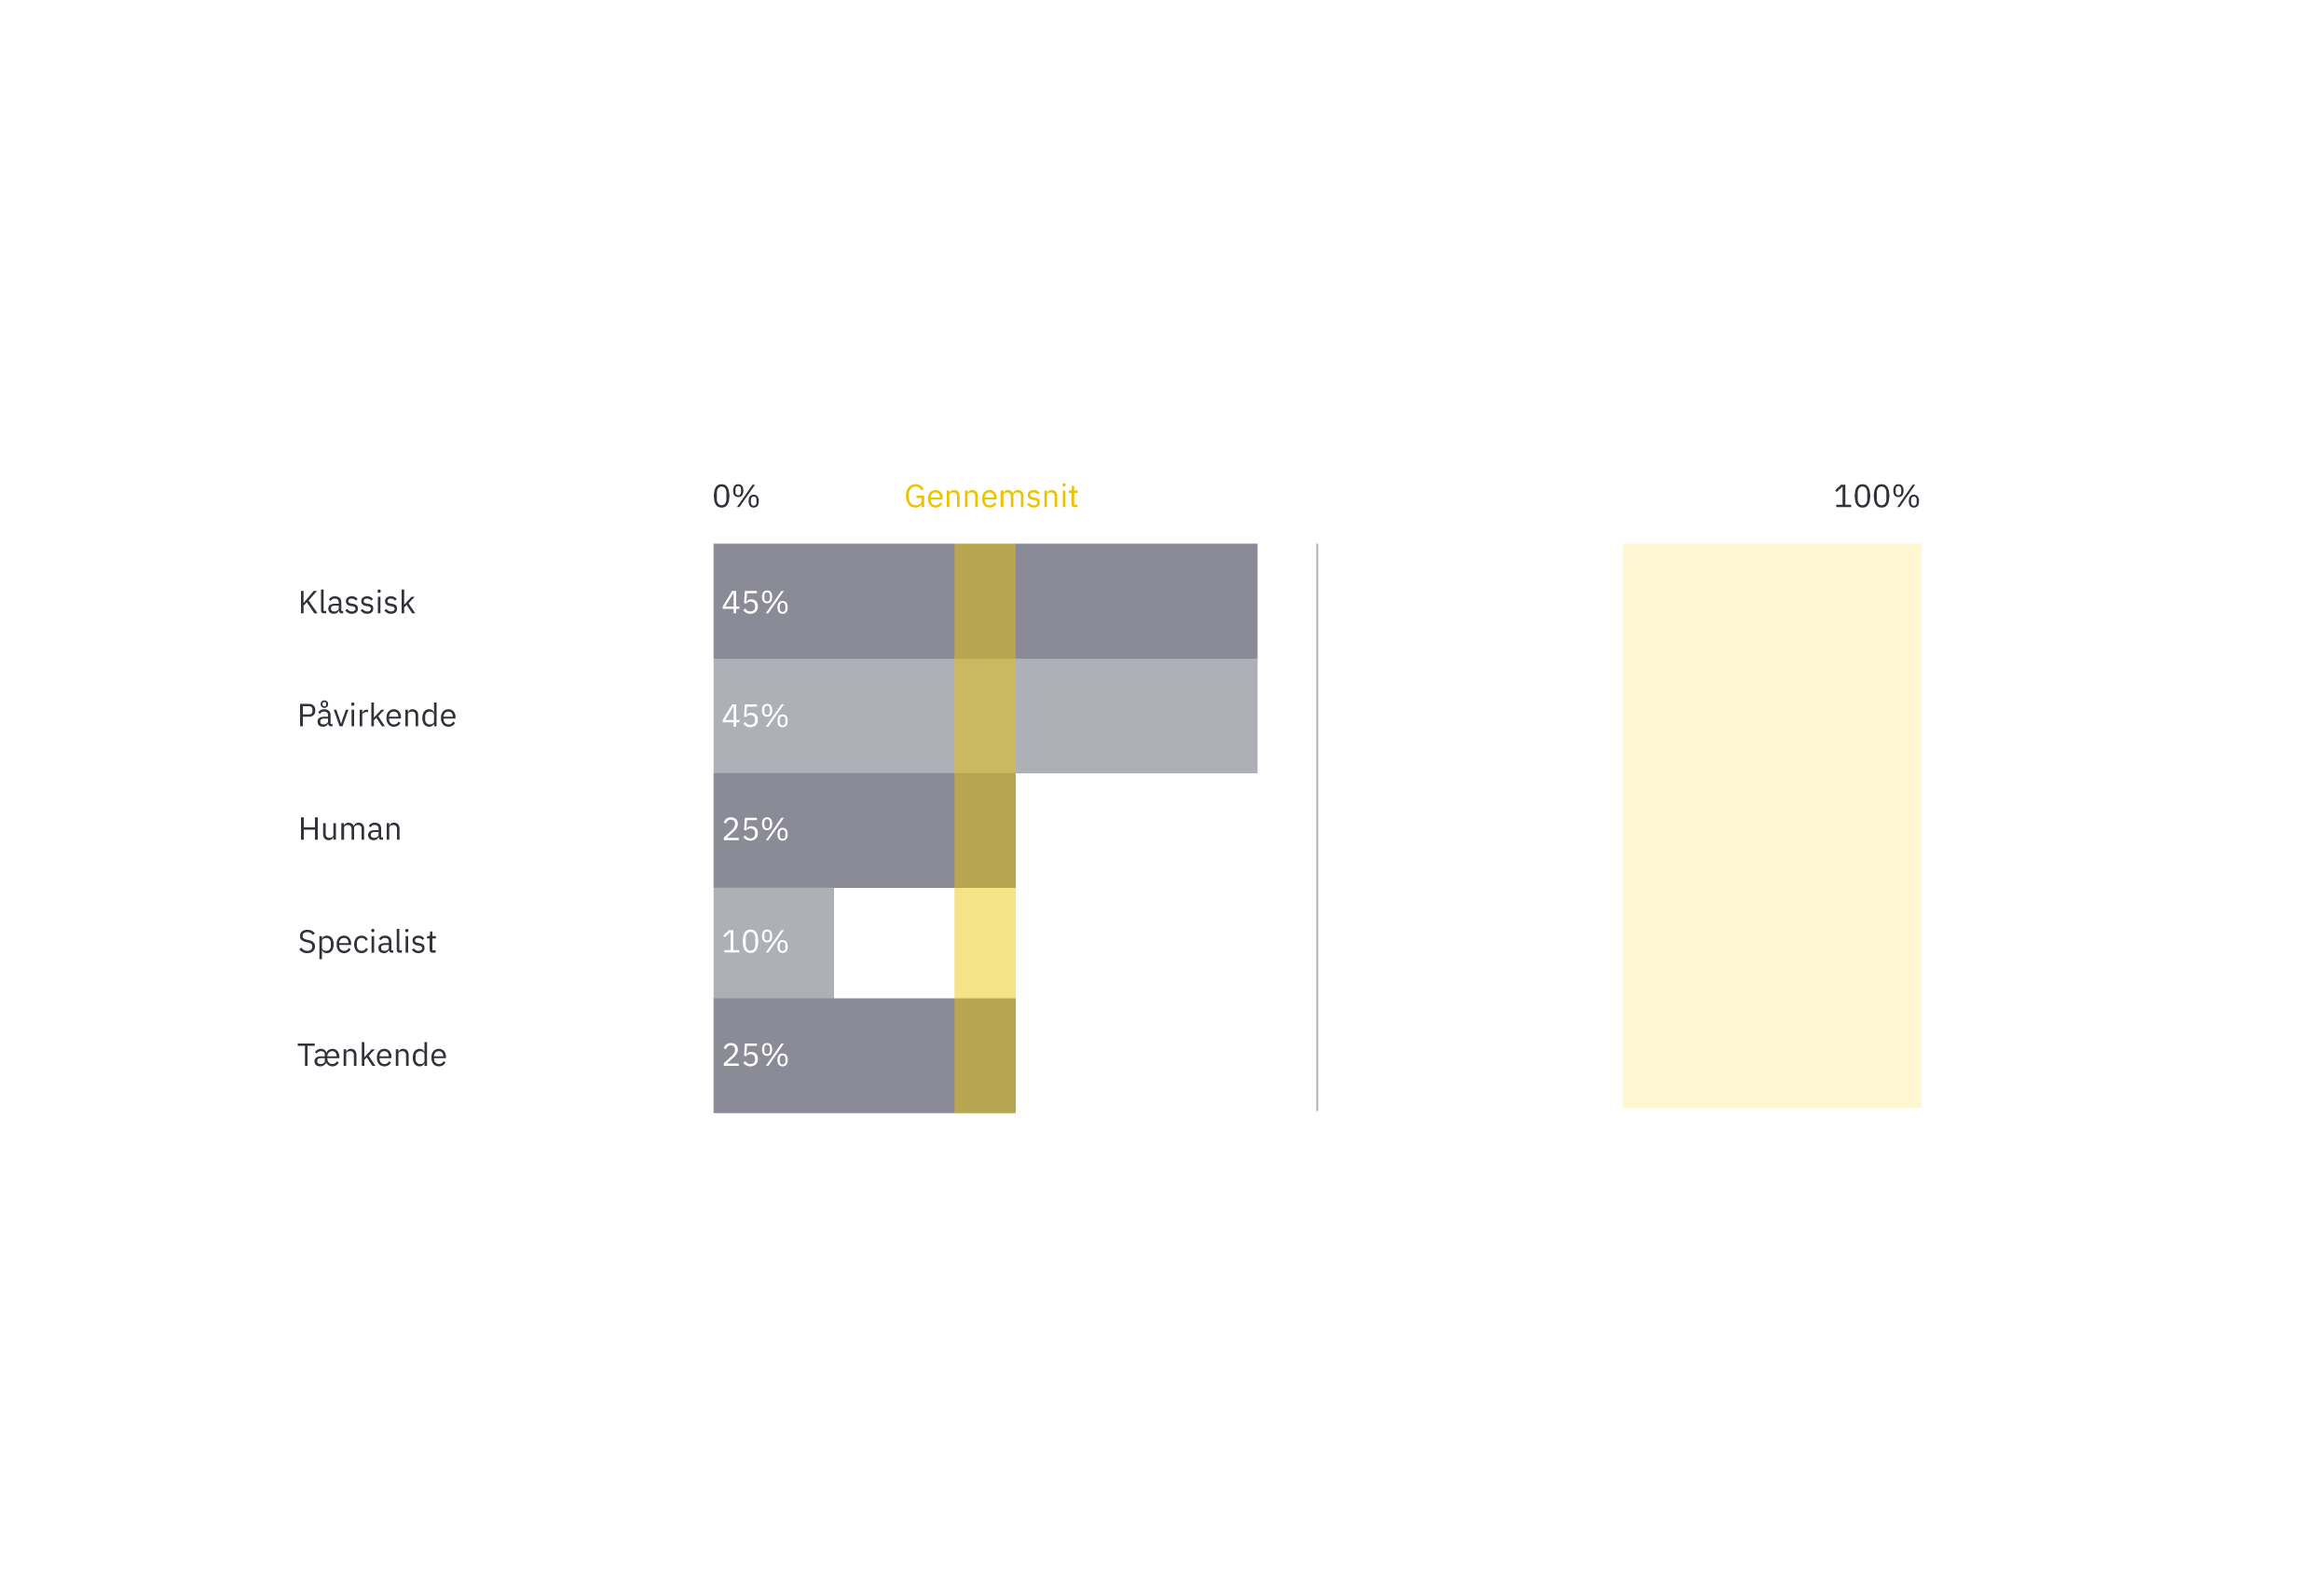
Inner Drivers
This graph describes your spark and inner motivation – what makes you love being at work! There are 5 main categories for inner drivers within individuals. The “Classic” drive is triggered by results. The “Influencing” drive is triggered by situations where the individual can influence and affect things. The “Human” drive is triggered by the presence of other people and their uniqueness. The “Specialist” drive is triggered by high professionalism. The “Intellectual” drive is triggered by detailed and complex thinking. Inner Drivers provide insight into what remains a constant drive within an individual, and can be useful for managers to cater for their employees drives and provide specific elements in their day-to-day to make them highly committed. The graph can also help reveal an individual’s bias or tendency to to assume that other people are driven by the same things, which obviously is not always the case.
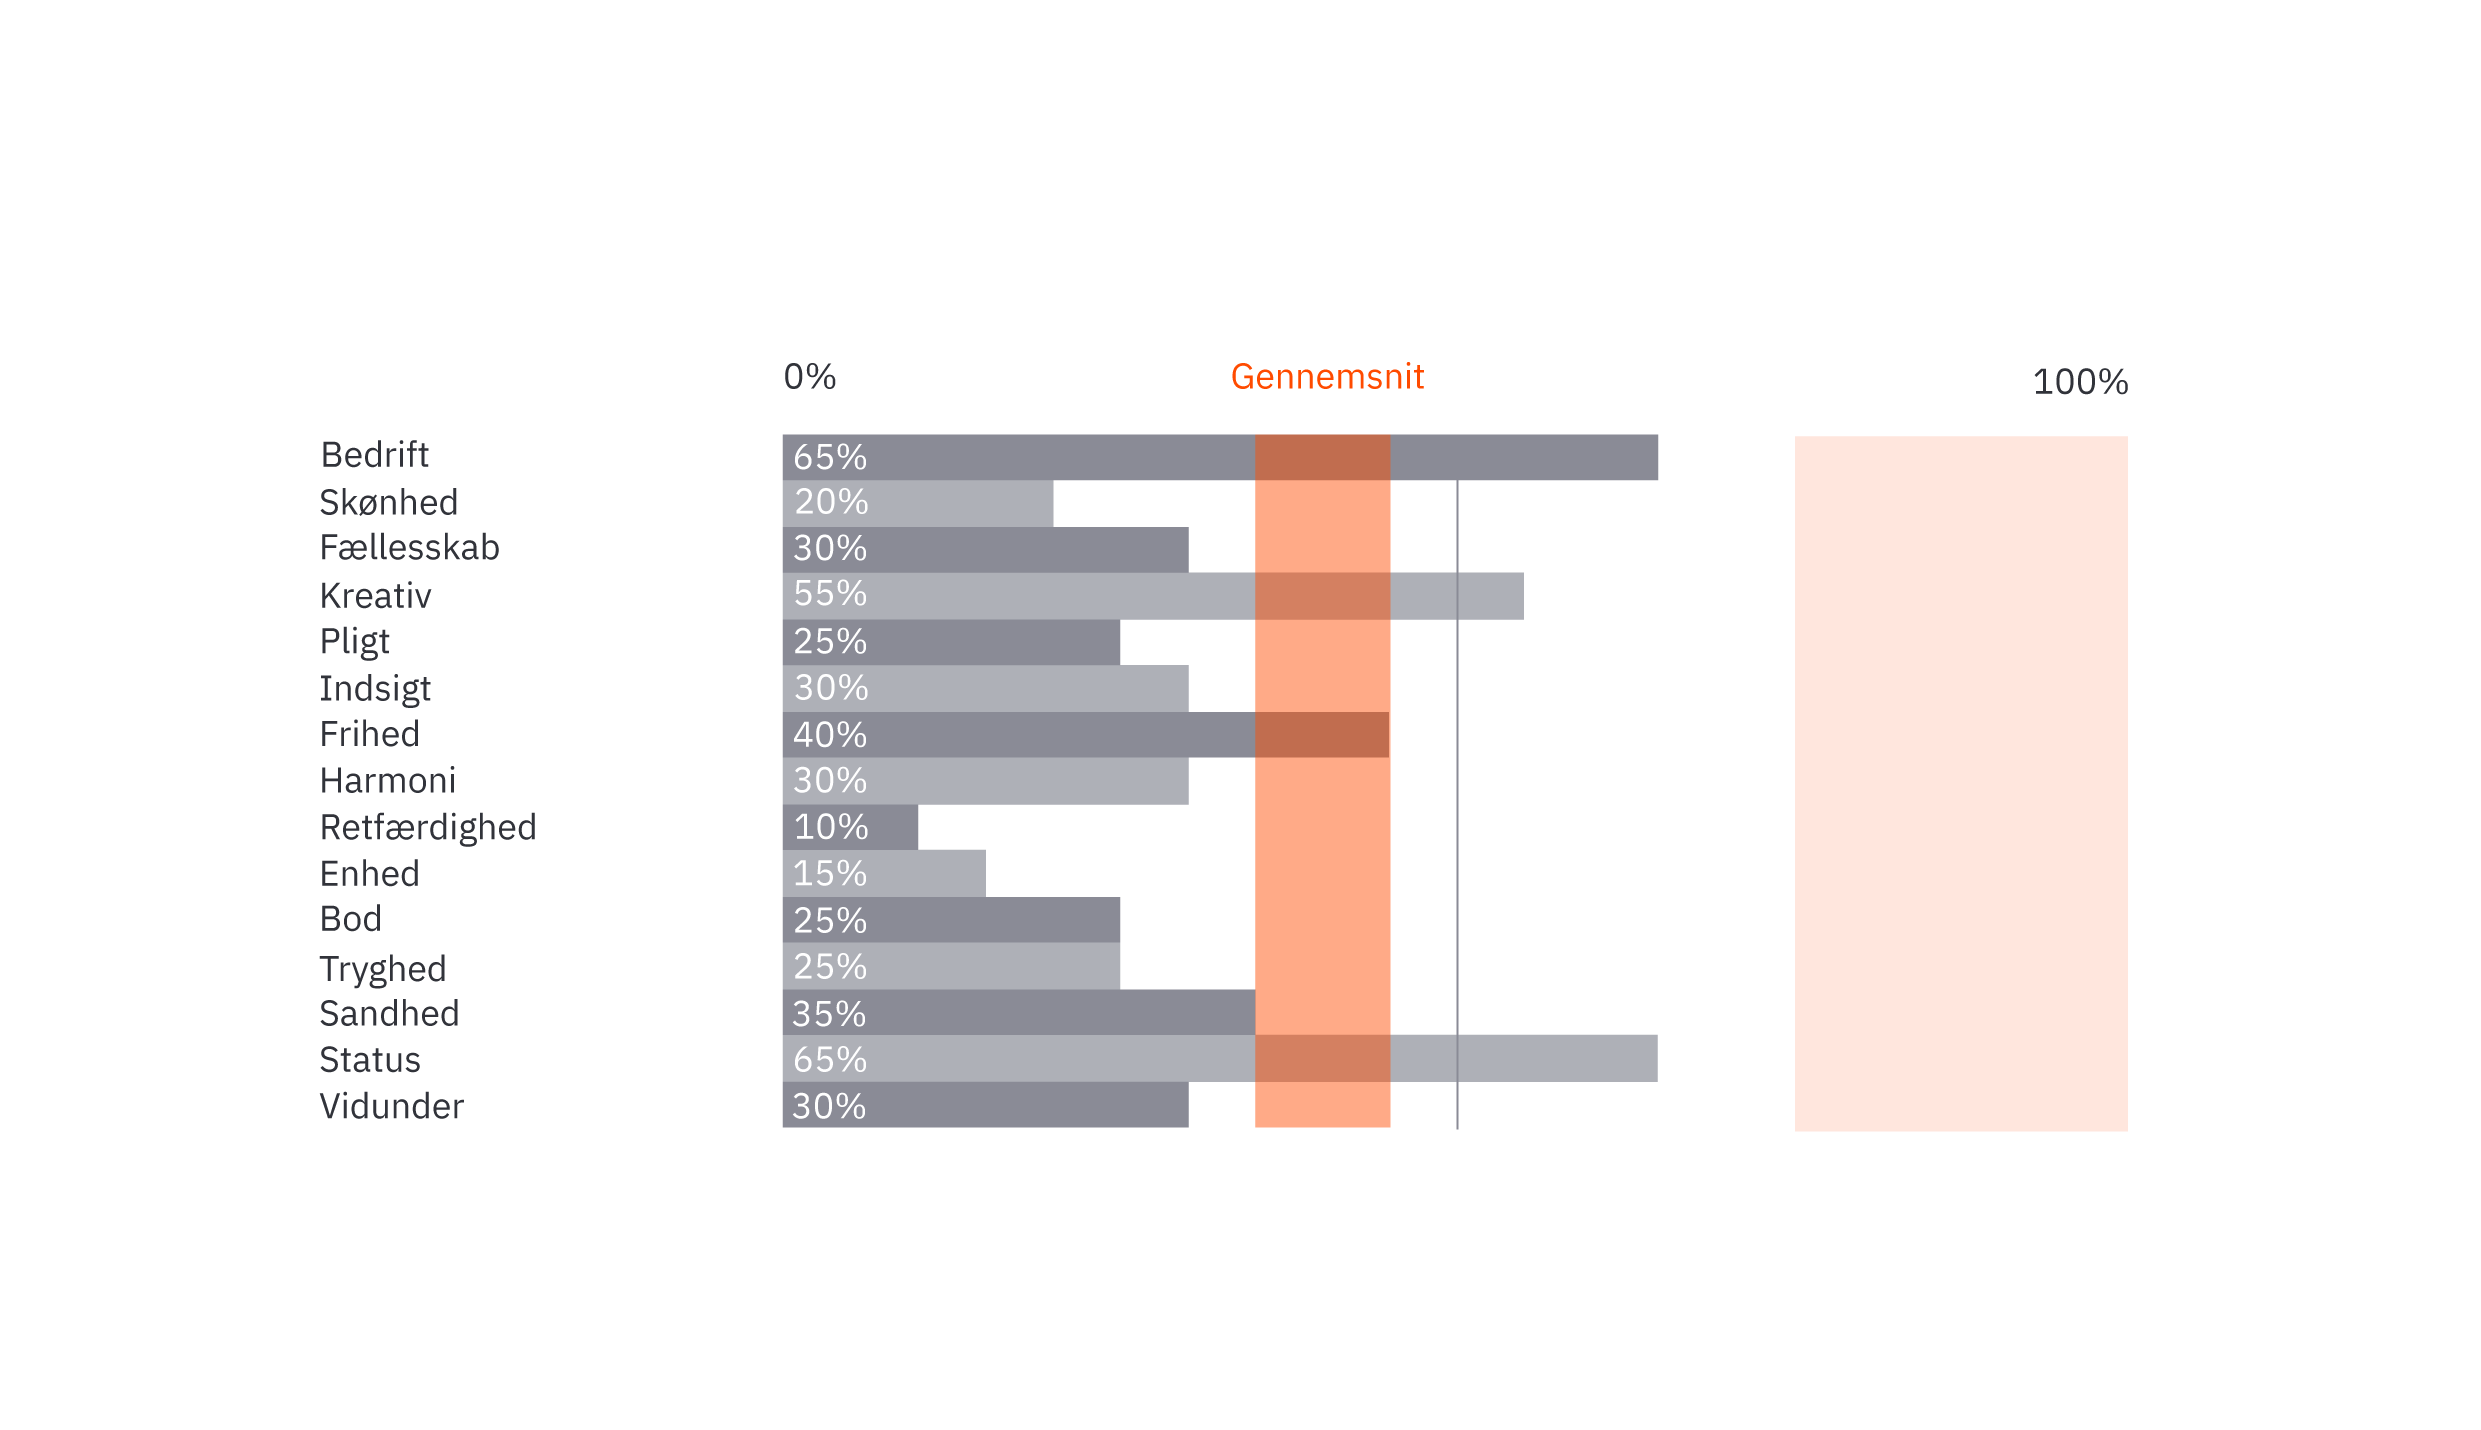
Motivational Triggers
This graph illustrates what motivational factors an individual values the most and least. Based on the 15 motivational factors, you can tailor individualised incentive programmes that directly relate to the motivations of the unique individual rather than the usual “cookie cutter” motivational programmes. Individuals likewise become acutely aware of their own basis for motivation, and external factors and elements can be put in place to get the best out of the individual and make them highly motivated in the workplace. If the highest scoring motivation factors are fulfilled in the workplace, then individuals are likely to be more engaged and committed. However, if the high scoring motivational triggers are ignored and unfulfilled, individuals are likely to become dissatisfied with their situation and perhaps even quit their job.
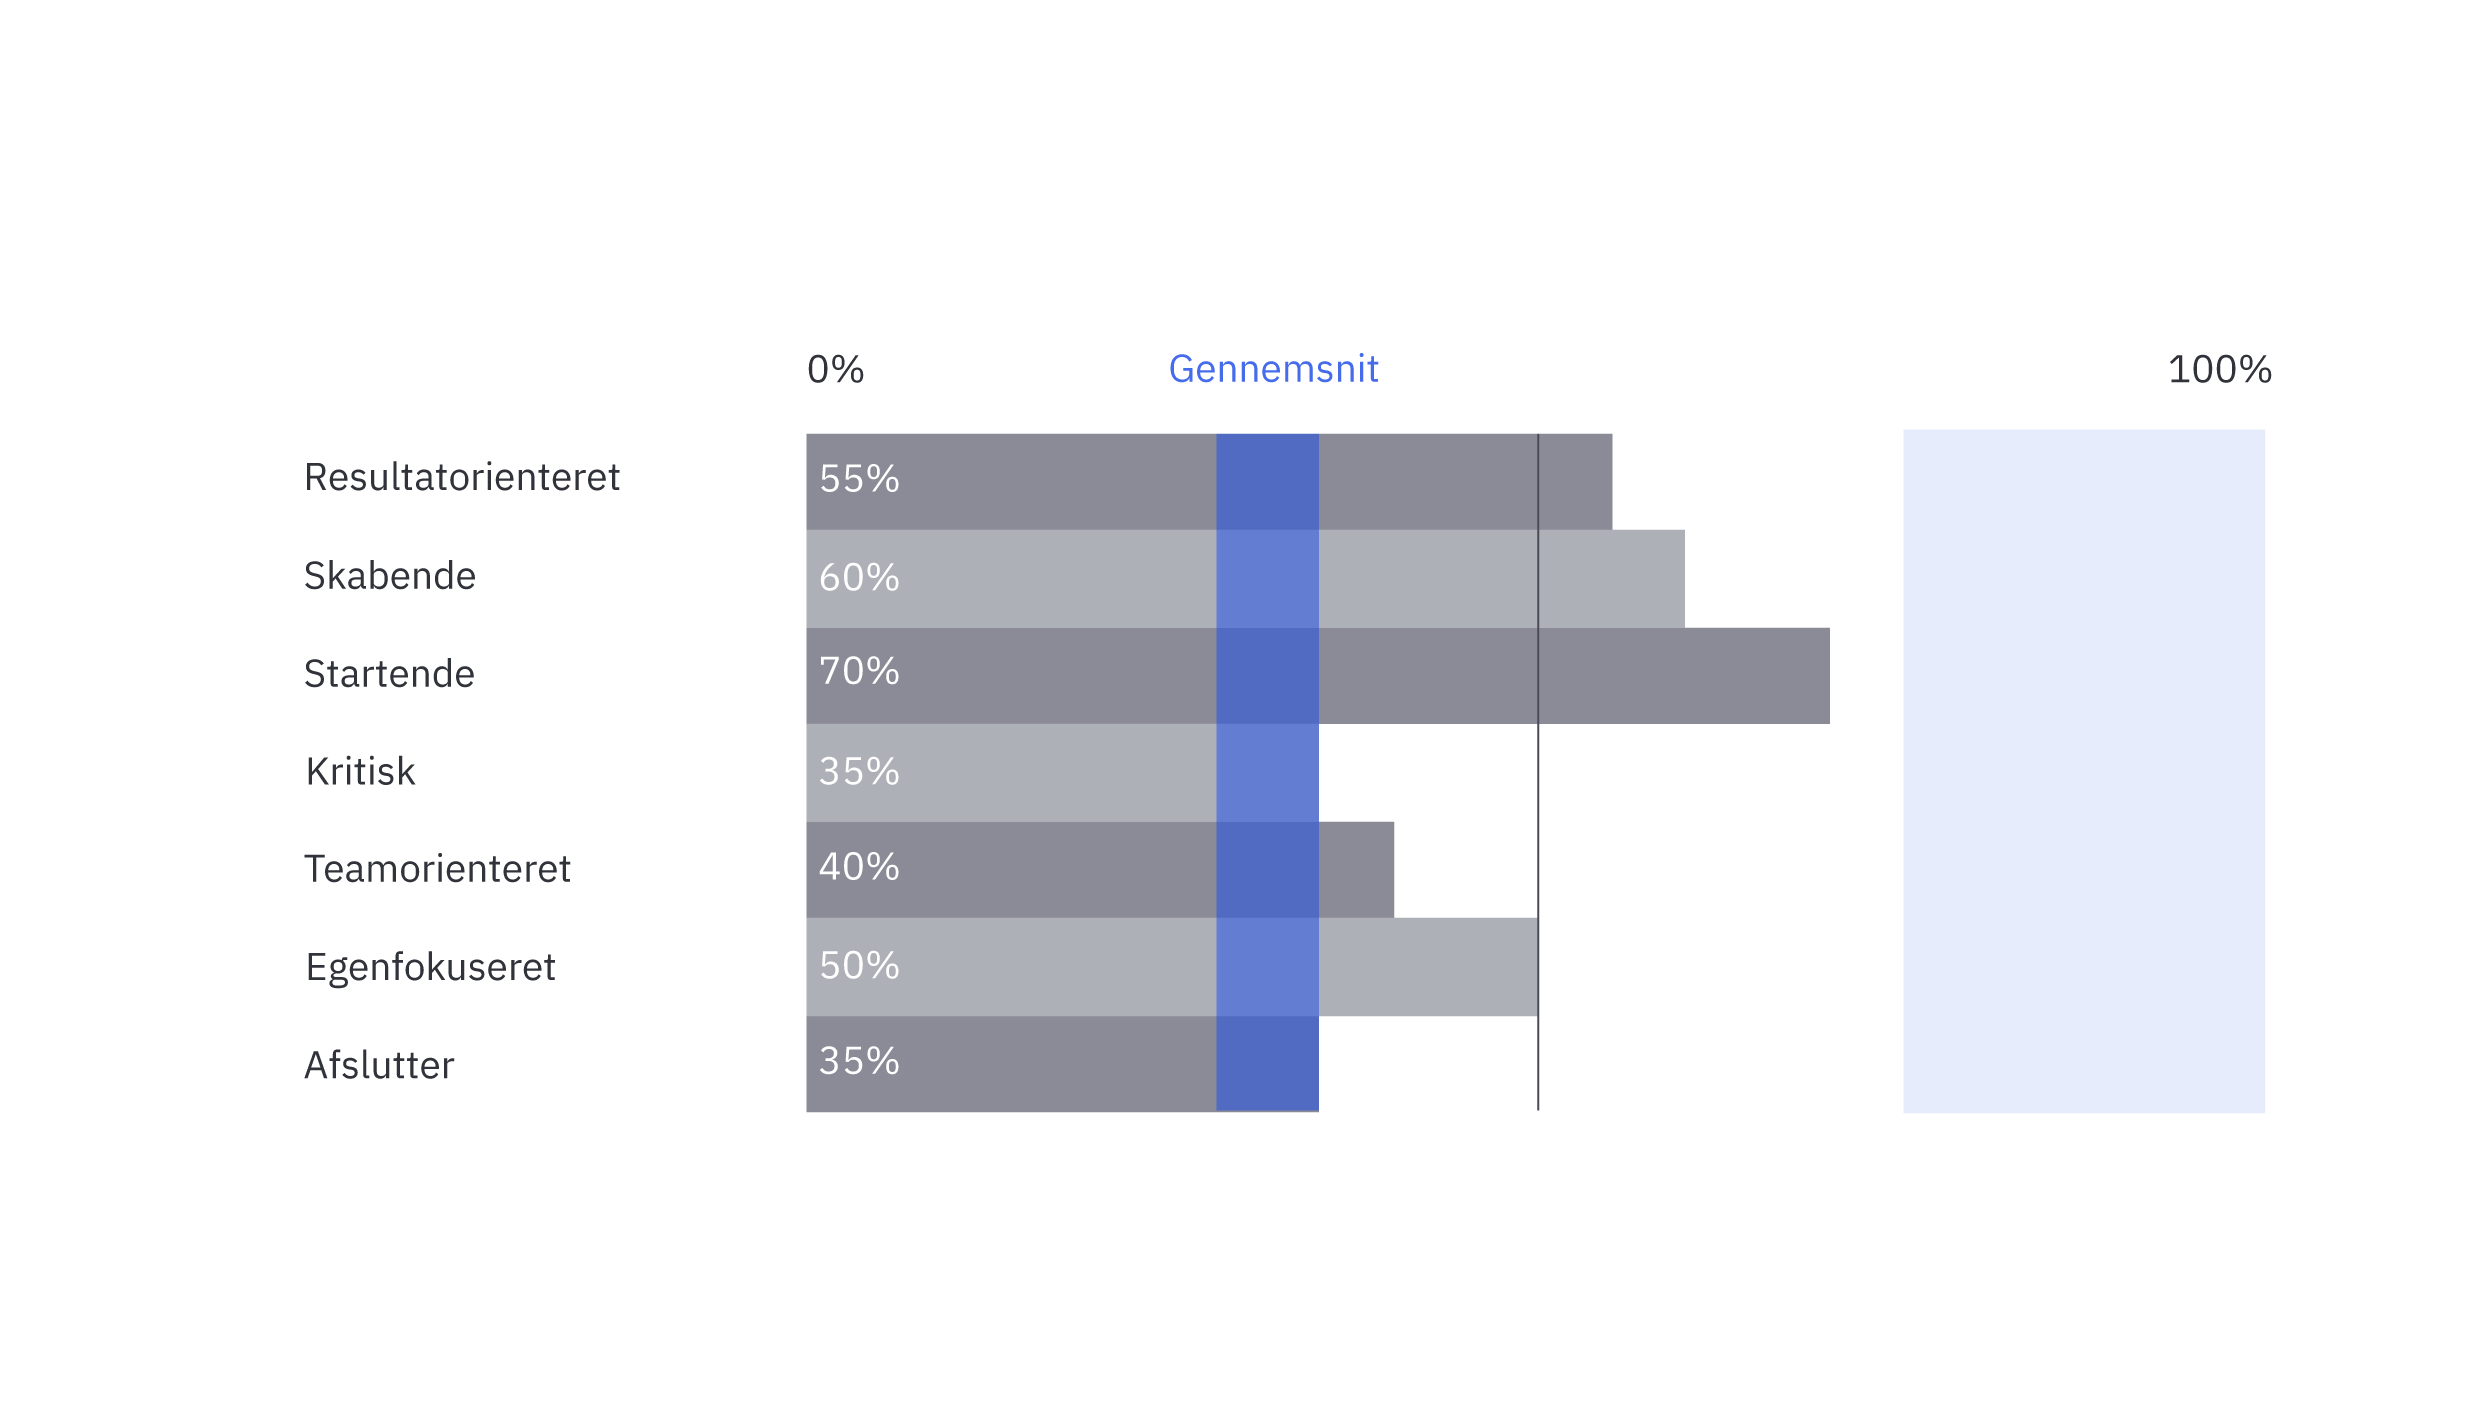
Workplace Behaviour
This graph describes the typical workplace behaviour of an individual and how that individual works with their talent composition in relation to the seven factors. Management and HR departments are often interested in the information provided in this graph, while it is also particularly useful in team management.
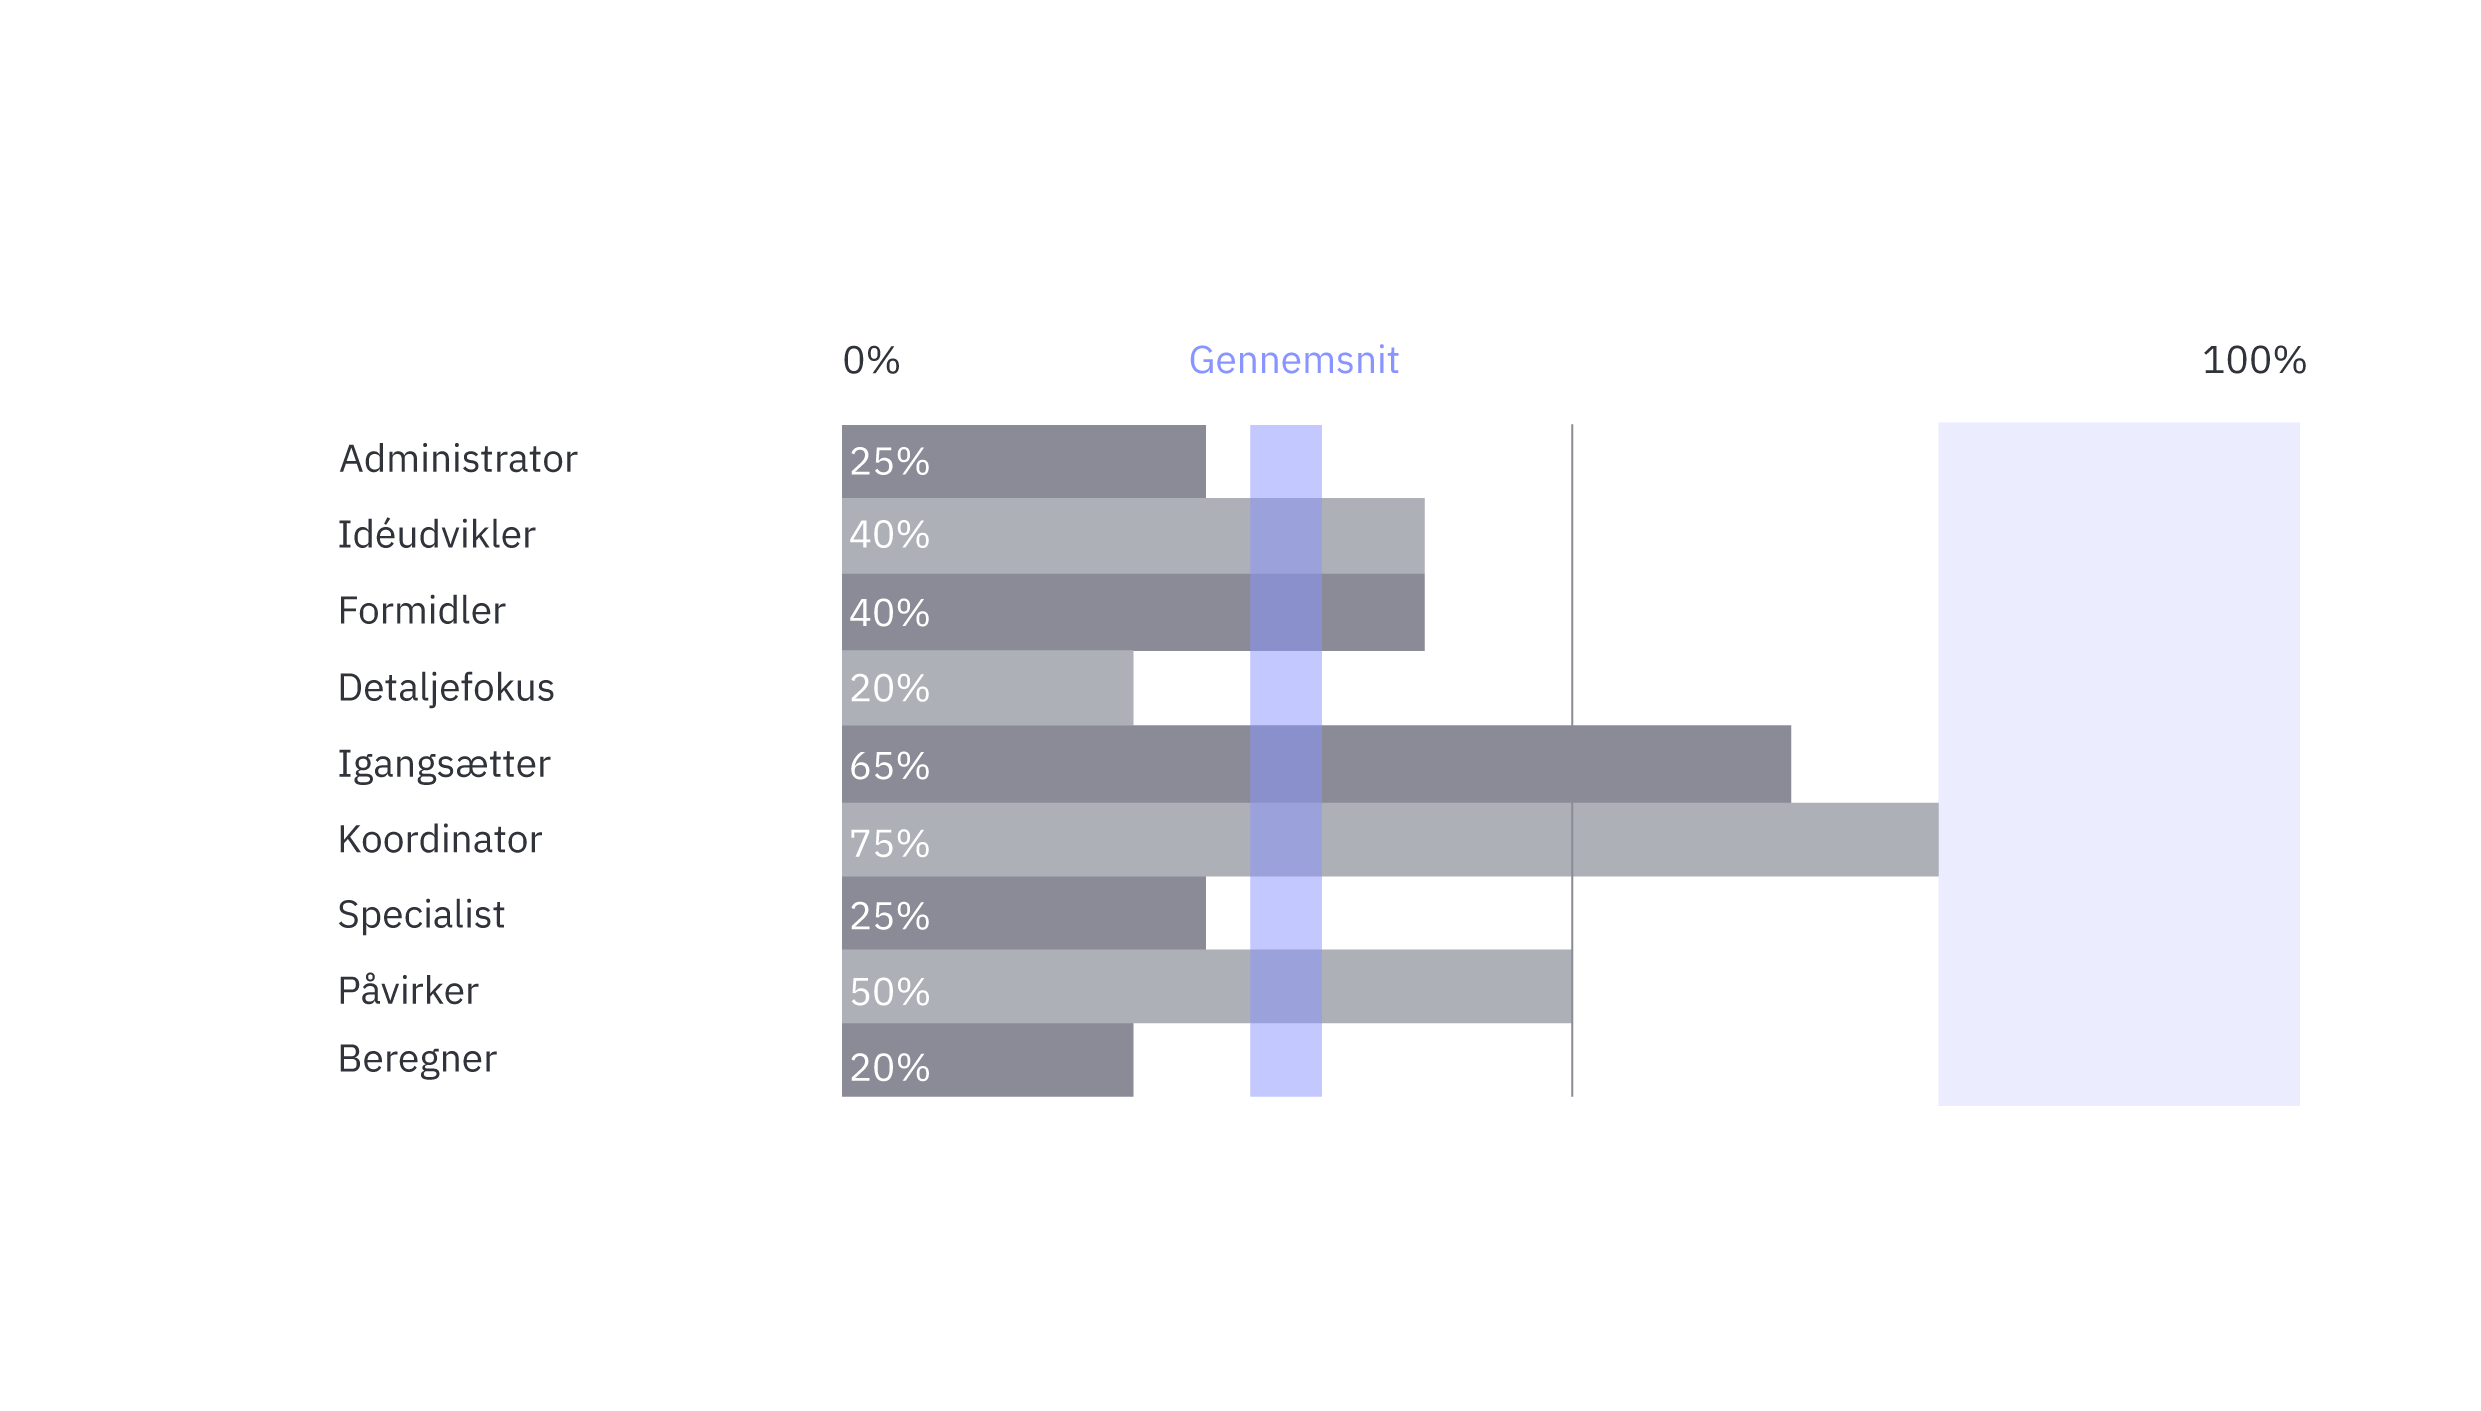
Team Strengths
The team strengths graph serves two purposes. Firstly, it shows which team roles are likely to best fit the talent profile of a specific individual, thus leading to a more collaborative and productive team dynamic due to individuals performing optimally in their preferred roles. Secondly, it helps management compose teams effectively, as they can ensure that all roles and elements of a team are covered and fulfilled by those with the right talents.
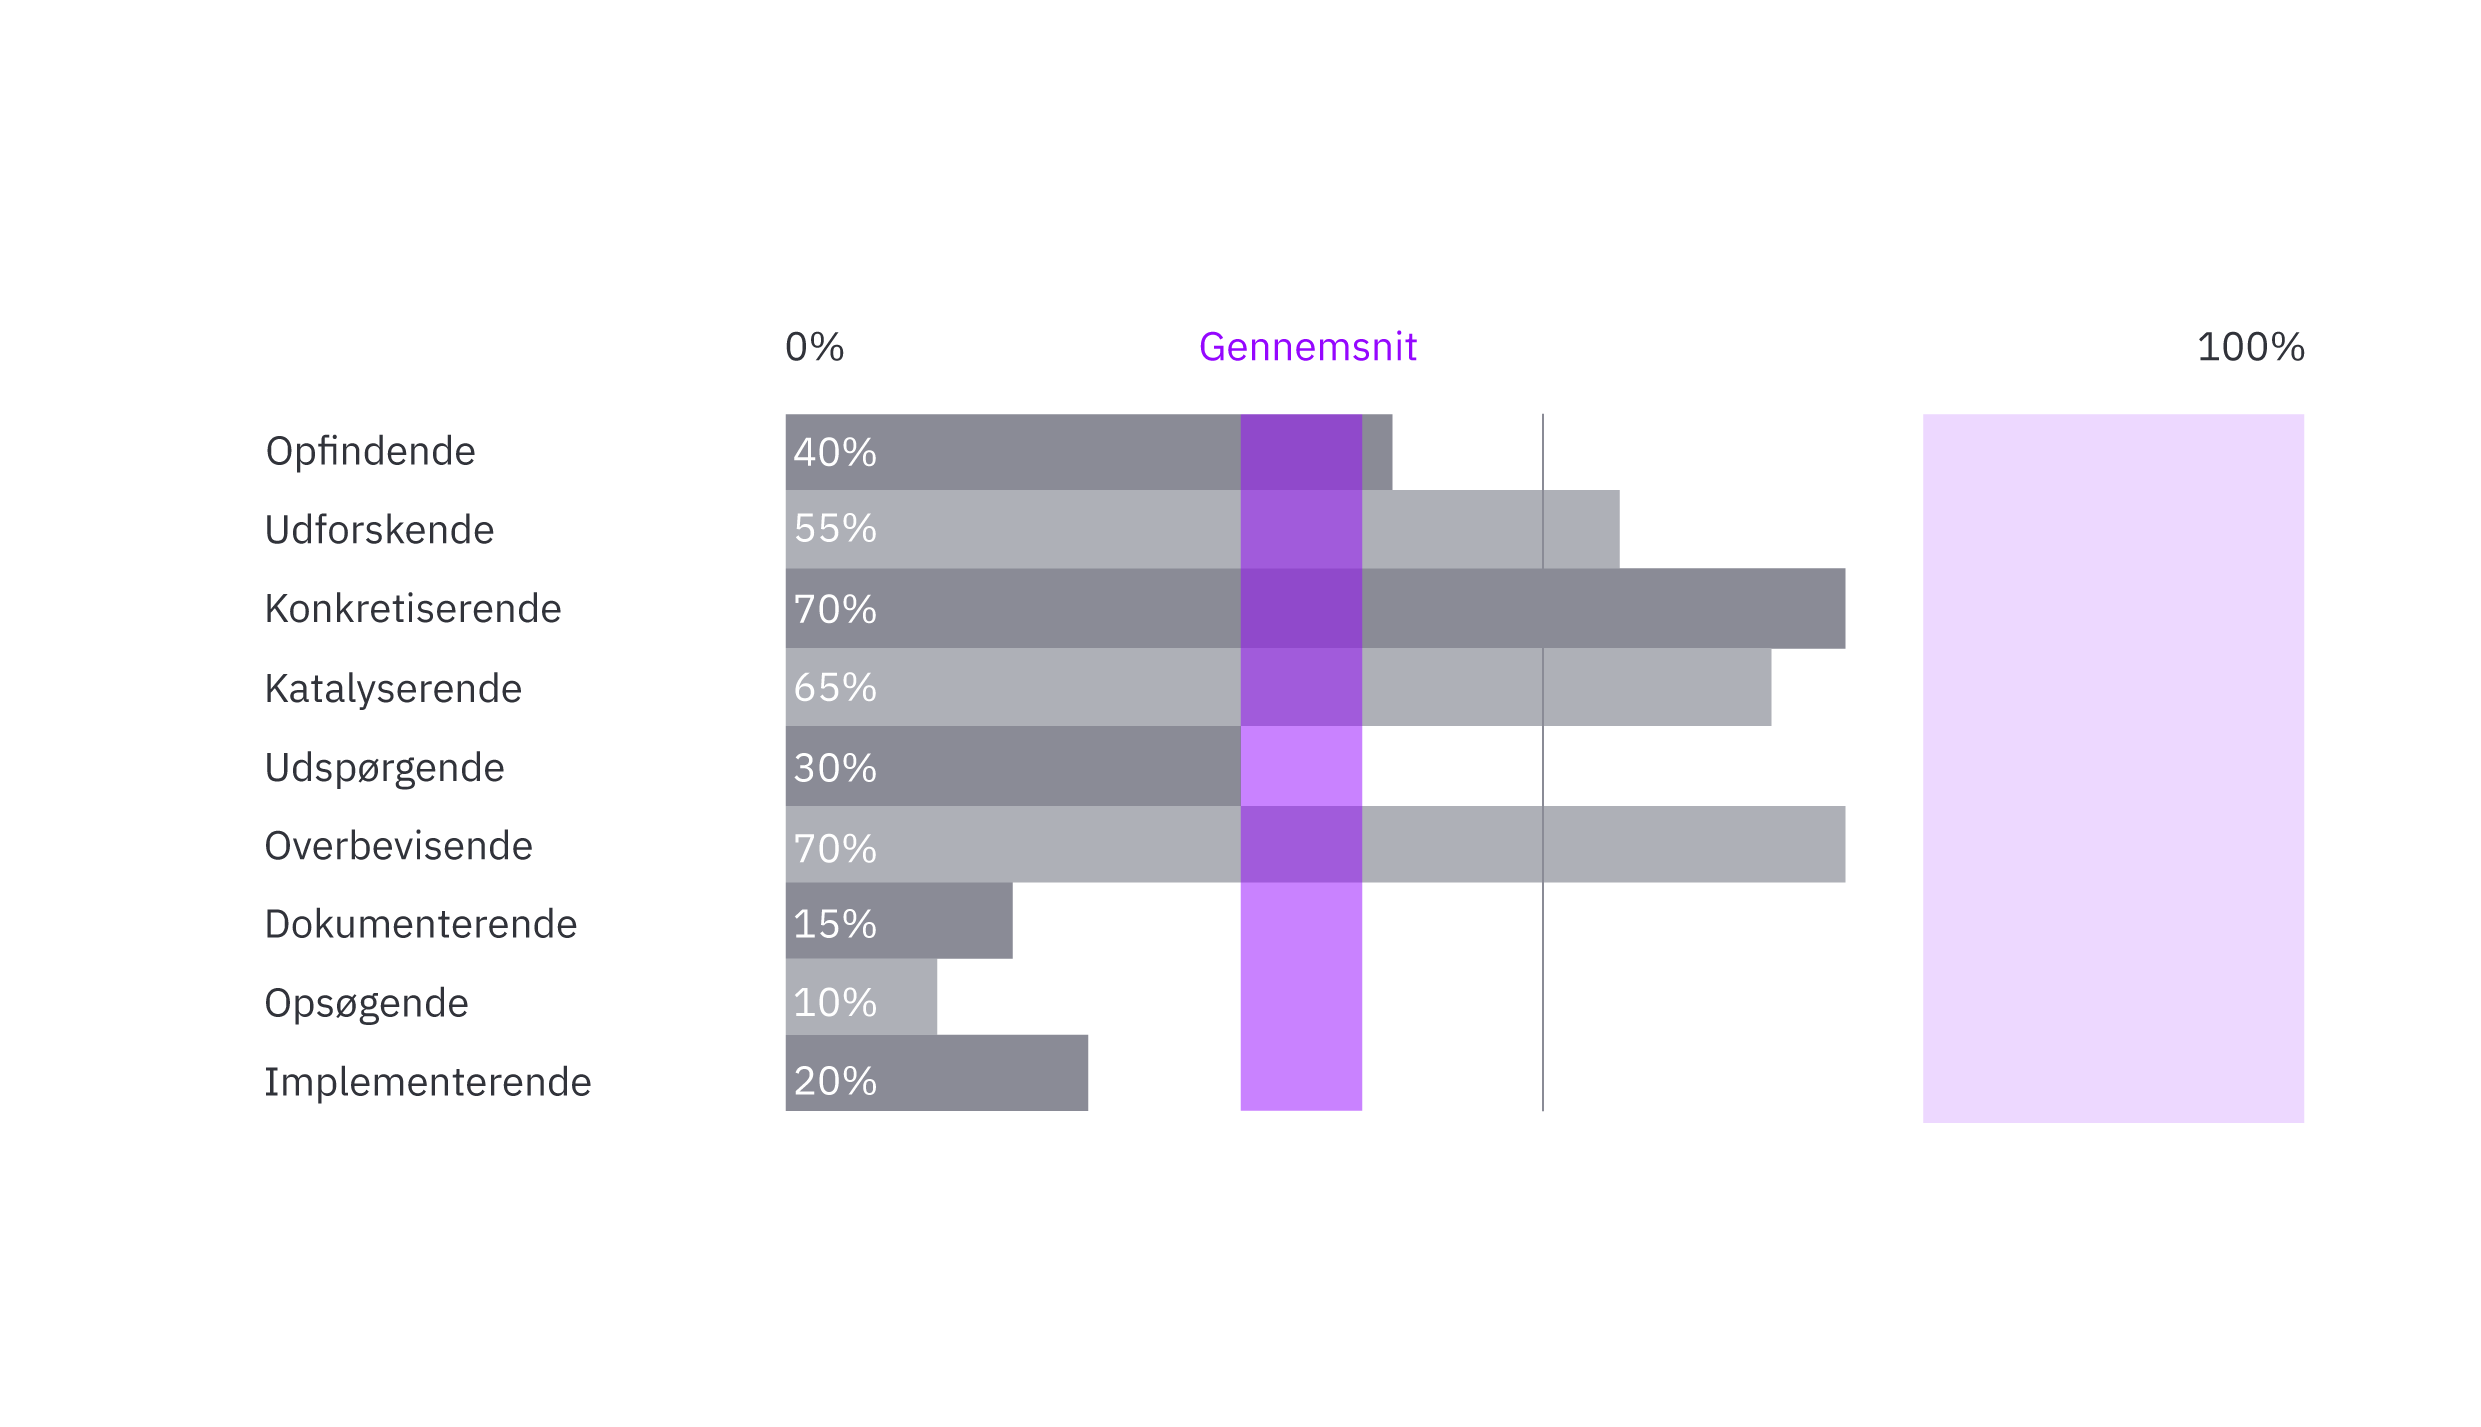
Innovation Process Input
This graph refers to the contribution and input an individual has in relation to innovation processes and the generation of new knowledge within organisations. In order for an innovation to be successful, 9 types of input are required. These 9 types of input are arranged chronologically in the graph and can be divided into the creative/innovate stage (‘Inventing’, ‘Exploring’, ‘Concretising’), the involving/inclusive stage (‘Catalysing’, ‘Questioning’, ‘Convincing’) and the implementation/control stage (‘Documenting’, ‘Investigating’, ‘Implementing’). In order to make an idea become a reality, it is important to know one’s own (and others’) contribution to the process. The graph is used to put together the right innovation teams in order to achieve the end goal. With this graph you can ensure that the right people are on board at the right stage of the innovation process, where they each can add the most value. This enables the optimisation of resources and resource planning in projects.
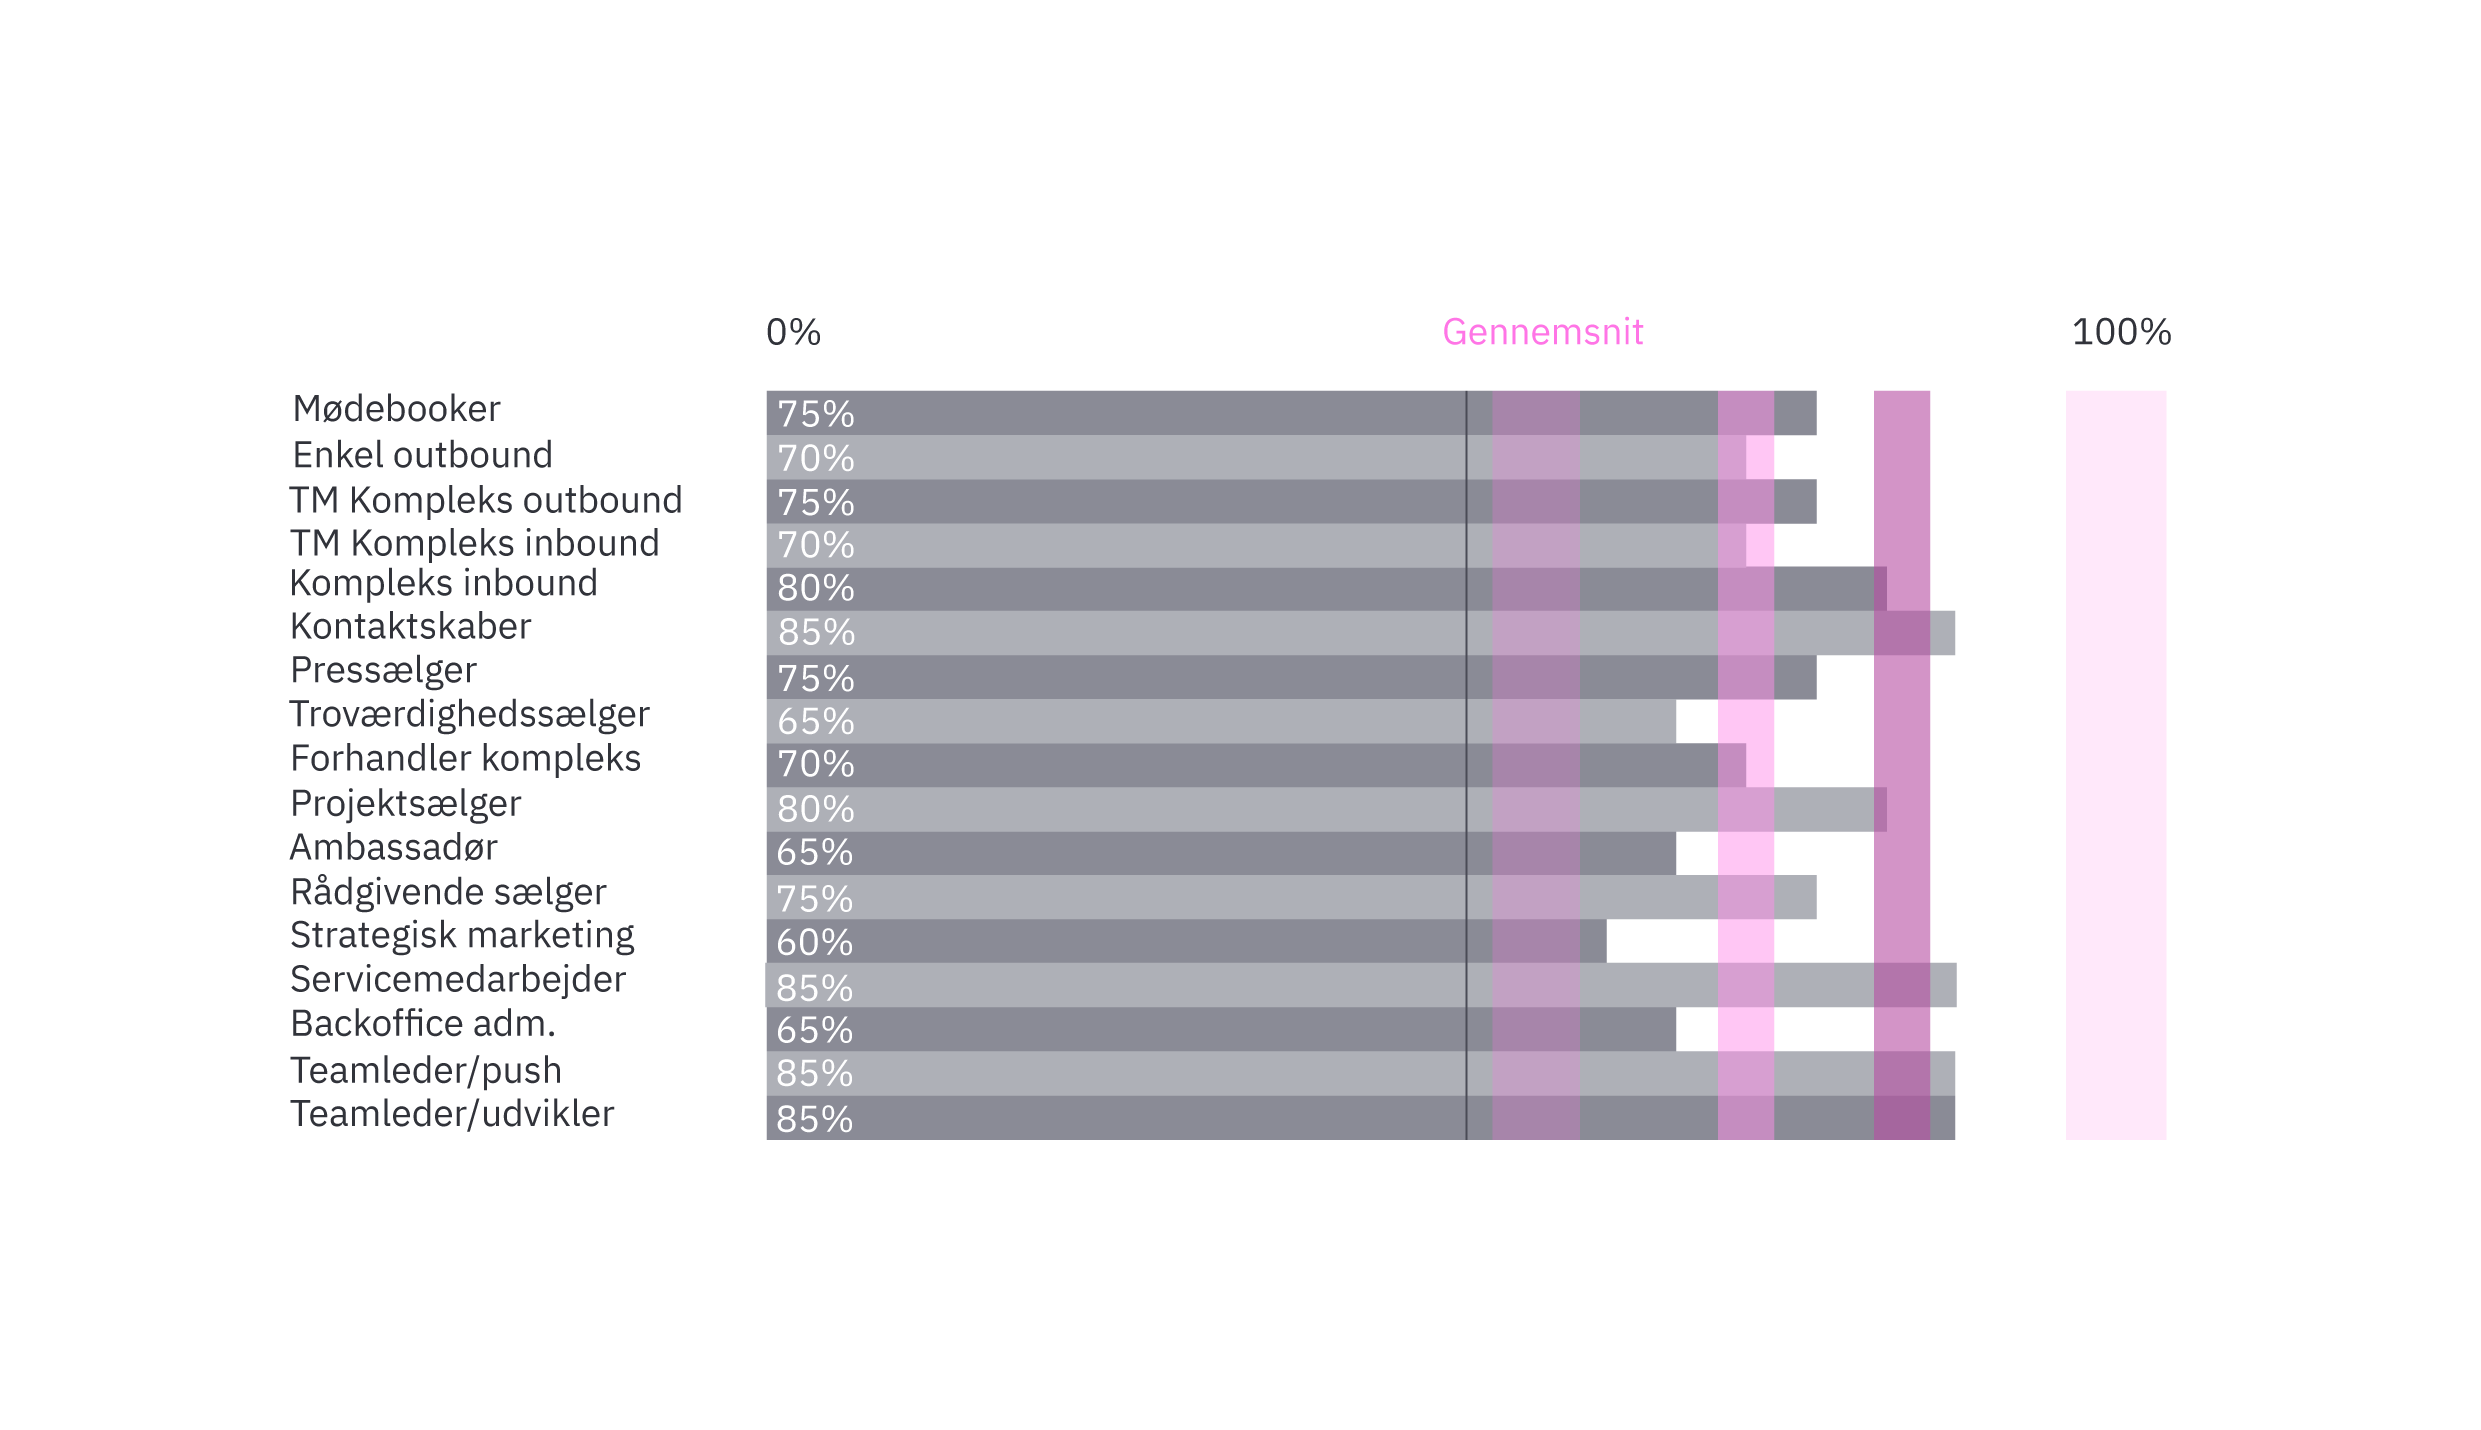
Sales Roles
This graph provides a clear picture of which sales roles an individual has the most potential in and is most likely to excel in. The graph uncovers a total of 17 sales roles, so a nuanced picture is presented and illustrates the potential against to 3 benchmarks: average (55% – 60%), good (70%+) and the top salespeople (80%+). How high a score is determines how quickly that person can learn to sell in that specific role, and an individual can score highly across several of the sales roles. Additionally, the graph shows which products the salesperson would find easier to sell and which market segments they are likely to have the most success with.
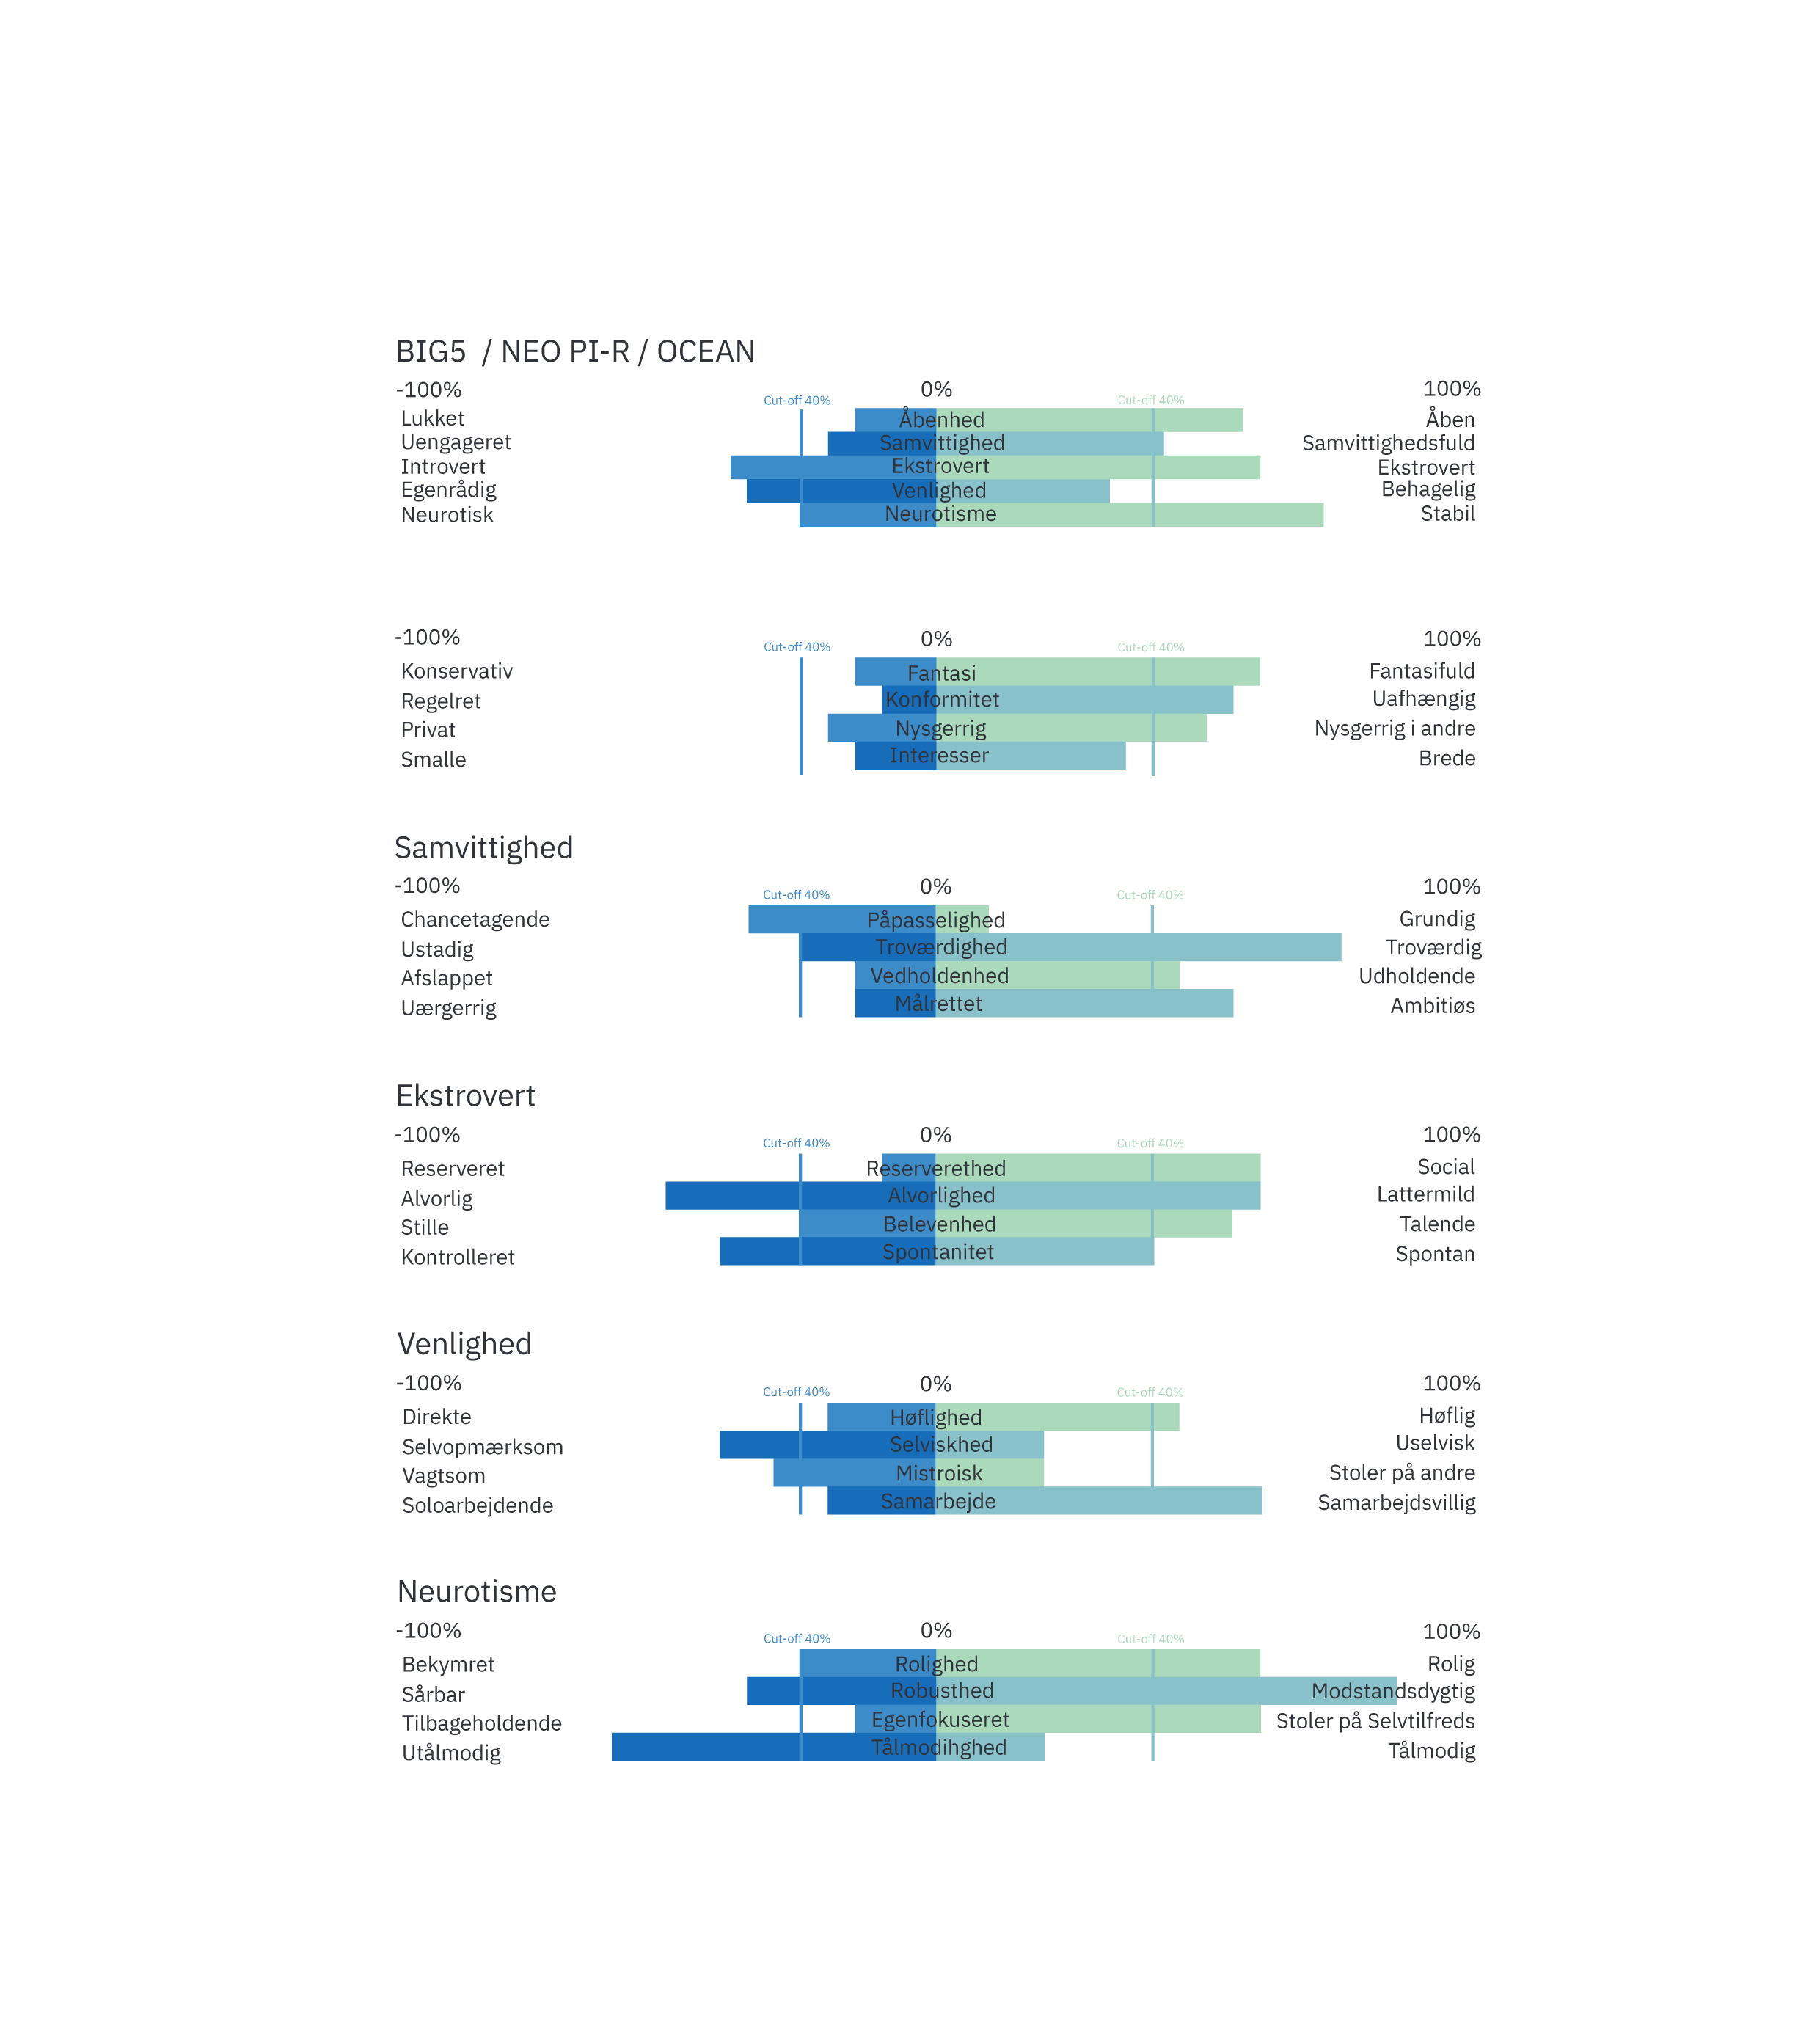
BIG 5 / NEO-PIR / OCEAN
The talents of an individual provide an indicator of their personality in relation to the “Big 5” model. There are five overall dimensions within personality: Openness, Conscientiousness, Extroversion, Agreeableness and Neuroticism. This graph is a very effective and useful conversation and developmental tool, particularly between employers and their new or existing employees.
